Saturday, December 31, 2022

Persistence and LOLBins

Grzegorz/@0gtweet tweeted something recently that I thought was fascinating, suggesting that a Registry modification might be considered an LOLBin. What he shared was pretty interesting, so I tried it out.

First, the Registry modification:

reg add "HKLM\System\CurrentControlSet\Control\Terminal Server\Utilities\query" /v LOLBin /t REG_MULTI_SZ /d 0\01\0LOLBin\0calc.exe

Then the command to launch calc.exe:

query LOLBin

Now, I've tried this on a Windows 10 system and it works great, even though Terminal Services isn't actually running on this system. Running just the "query" command on both Windows 10 and Windows 11 systems (neither with Terminal Services running) results in the same output on both:

C:\Users\harlan>query
Invalid parameter(s)
QUERY { PROCESS | SESSION | TERMSERVER | USER }

Running the "query" command with different parameters (i.e., "process", "user", etc.) proxies that command to the appropriate entry based on the value in the Registry, as illustrated in figure 1.

Fig 1: query key values


As such, running "query user" runs quser.exe, and you see the same output as if you simply ran "quser". 

Note that the Utilities key has two other subkeys, in addition to "query"; "change" and "reset", as illustrated in fig. 2.

Fig. 2: Utilities subkeys


So, I thought, what if I change the key path from "query", and make the same modification (via the 'reg add' command above) to the "change" subkey...would that have the same effect? Well, I tried it with an elevated command prompt, for both the "change" and "reset" subkeys, and got "Access is denied." both times. Okay, so we can only use this...at an Admin level, anyway...with the "query" subkey.

So what?
Part of what makes this particular persistence so insidious (IMHO) is how it can be launched. When we use the Run keys (or a Scheduled Task, or a Windows service) for persistence, an analyst may not have any trouble seeing the launch mechanism for the program/malware. In fact, even outside of Registry analysis, some SOC consoles will allow the analyst to see notable events, and even provide enough process lineage to allow the analyst to deduce that a notable event occurred.

To Grzegorz's point, this is an interesting LOLBin, because query.exe exists on the system by default. IMHO, this is important because when I started learning computers over 40 yrs ago (yes, circa 1982), all we had was the command line; as such, understanding which commands were available on the system, as well as things like STDOUT, STDERR, file redirection, etc., were all just part of what we learned. Now, 40 yrs later, we have entire generations of analysts (SOC, DFIR, etc.) who "grew up" without ever touching a command line. So, when I saw Grzegorz's tweet, the first thing I did was go the command prompt and type "query", and saw the response listed above. Easy peasy...but how many analysts do that? What's going to happen if a SOC analyst sees telemetry for "query user"? Or, what happens if a DFIR analyst sees a Prefetch file for query.exe? What assumptions will they make, and how will those assumptions drive the rest of their analysis and response?

What is a way to use this? Well, let's say you gain access to a system...and this is just hypothetical...and run a script that enables RDP (if it's not already running), enables StickyKeys, writes a Trojan to an alternate data stream (thanks to Dr. Hadi for some awesome research!!) and then creates a value beneath the "query" key for the Trojan. That way, if your activity on other systems gets discovered, you have a way back into the infrastructure that doesn't require authentication. Connect to the system via the Remote Desktop Client, access StickyKeys so that you get a System-level command prompt, and you type "query LOLBin". Boom, you're back in!

As you might expect, I did write a RegRipper plugin for this persistence mechanism, the output of which makes it pretty straightforward to see any changes that may have been made. For example, "normal" look like the following:

utilities v.20221231
(System) Get TS Utilities subkey values
Category: persistence - T1546

ControlSet001\Control\Terminal Server\Utilities\change
LastWrite time: 2018-04-12 09:20:04Z
logon           0 1 LOGON chglogon.exe
port            0 1 PORT chgport.exe
user            0 1 USER chgusr.exe
winsta          1 WINSTA chglogon.exe

ControlSet001\Control\Terminal Server\Utilities\query
LastWrite time: 2018-04-12 09:20:04Z
appserver       0 2 TERMSERVER qappsrv.exe
process         0 1 PROCESS qprocess.exe
session         0 1 SESSION qwinsta.exe
user            0 1 USER quser.exe
winsta          1 WINSTA qwinsta.exe

ControlSet001\Control\Terminal Server\Utilities\reset
LastWrite time: 2018-04-12 09:20:04Z
session         0 1 SESSION rwinsta.exe
winsta          1 WINSTA rwinsta.exe

Analysis Tip: The "query" subkey beneath "\Terminal Server\Utilities" can be used for persistence. Look for unusual value names.

Ref: https://twitter.com/0gtweet/status/1607690354068754433
Keeping Grounded

As 2022 comes to a close, I reflect back over the past year, and the previous years that have gone before. I know we find it fascinating to hear "experts" make predictions for the future, but I tend to believe that there's more value in reflecting on and learning from the past.

Years ago, I remember hearing about something in legal circles referred to as "the CSI effect". In short, the unrealistic portrayal of "forensics" on TV shows had influenced public opinion. People would watch an hour-long crime drama TV show and what they saw set the expectation in their minds of "forensics" should be, and this unrealistic expectation made it difficult for prosecutors to convince some juries of their evidence.

Over the holiday season, a "bomb cyclone" across the US combined with the numbers of folks wanting to travel to cause travel delays with the airlines, as one might expect. Planes needed to be deiced, but at some locations, travel was simply impossible. However, one airline in particular experienced heavier than usual delays and cancellations, to the point where the Transportation Secretary took notice. For several days, the evening national news covered this story, focusing in on the failures of the airline, and how stranded passengers were standing in long lines just to seek assistance from the airline's customer service. As each day went by and media reports highlighted how the cascading failures were snowballing and impacting travelers, all of this served to create an sense of negativity toward the airline management. Everyone I spoke with over the holidays had the same negative perspective of the airline's management.

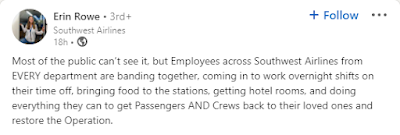
On the morning of 28 Dec 2022, I saw the following post on LinkedIn:


Erin's message served as a stark reminder that there's often more to the story, that regardless of what we see being reported in the media, there are often stories that are not covered and reported, and that do not make it into the public eye. News outlets have a limited amount of time to cover a hand-picked menu of events of the day, so we have to be conscious of "collection bias", and if what we're seeing and hearing is playing into a narrative that we assume is correct.

The point here is to remain grounded, and as we roll over into the New Year, this is a good opportunity to make a resolution to remain grounded, and to seek out accountability partners and mentors to help us remain grounded. Don't be so focused on the negative aspects of an event that we loose sight of the positive things that happen, and that the folks who make those positive things happen need our support more than someone we believe is to blame needs our anger. 

Sunday, December 25, 2022

Why I love RegRipper

Yes, yes, I know...you're probably thinking, "you wrote it, dude", and while that's true, that's not the reason why I really love RegRipper. Yes, it's my "baby", but there's so much more to it than that. For me, it's about flexibility and utility. At the beginning of 2020, there was an issue with the core Perl module that RegRipper is built on...all of the time stamps were coming back as all zeros. So, I tracked down the individual line of code in the specific module, and changed it...then recompiled the EXEs and updated the Github repo. Boom. Done. I've written plugins during investigations, based on new things I found, and I've turned around working plugins in under an hour for folks who've reached out with a concise request and sample data. When I've seen something on social media, or something as a result of engaging in a CTF, I can tweak RegRipper; add a plugin, add capability, extend current functionality, etc. Updates are pretty easy. Yes, yes...I know what you're going to say..."...but you wrote it." Yes, I did...but more importantly, I'm passionate about it. I see far too few folks in the industry who know anything about the Registry, so when I see something on social media, I'll try to imagine how what's talked about could be used maliciously, and write a plugin.

And I'm not the only one writing plugins. Over the past few months, some folks have reached out with new plugins, updates, fixes, etc. I even had an exchange with someone the other day that resulted in them submitting a plugin to the repo. Even if you don't know Perl (a lot of folks just copy-paste), getting a new plugin is as easy as sending a clear, concise description of what you're looking for, and some sample data.

Not long ago, a friend asked me about JSON output for the plugins, so I've started a project to create JSON-output versions of the plugins where it makes sense to do so. The first was for the AppCompatCache...I still have a couple of updates to do on what information appears in the output, but the basic format is there. Here's an excerpt of what that output currently looks like:

{
  "pluginname": "appcompatcache_json"
  "description": "query\parse the appcompatcache\shimcache data source"
  "key": ".ControlSet001\Control\Session Manager."
  "value": "AppCompatCache"
  "LastWrite Time": "2019-02-15 14:01:26Z"
  "members": [
    {
      "value": "C:\Program Files\Puppet Labs\Puppet\bin\run_facter_interactive.bat"
      "data": "2016-04-25 20:19:03"
    },
    {
      "value": "C:\Windows\System32\FodHelper.exe"
      "data": "2018-04-11 23:34:32"
    },
    {
      "value": "C:\Windows\system32\regsvr32.exe"
      "data": "2018-04-11 23:34:34"
    },

Yeah, I have some ideas as to how to align this output with other tools, and once I settle on the basic format, I can continue creating plugins where it makes sense to do so.

Recently, we've been seeing instances of "Scheduled Task abuse", specifically of the RegIdleBackup task. To be clear, while some have been seeing it recently, it's not "new"...Fox IT, part of the NCC Group, reported on it last year. It's also been covered more recently here in reference to GraceWire/FlawedGrace. Of all the reporting that's out there on this issue, what hasn't been addressed is how the modification to the task is performed; is the task XML file being modified directly, or is the API being used, such that the change would also be reflected in the Task subkey entry in the Registry?

From the RegIdleBackup task XML file:

<Actions Context="LocalSystem">
    <ComHandler>
      <ClassId>{CA767AA8-9157-4604-B64B-40747123D5F2}</ClassId>
    </ComHandler>
  </Actions>

So, we see the COM handler listed in the XML file, and that's the same CLSID that's listed in the Task entry in the Software hive. About 2 years ago, I updated a plugin that parsed the Scheduled Tasks from the Software hive, so I went back to that plugin recently and added additional code to look up CLSIDs within the Software hive and report the DLL they point to; here's what the output looks like now (from a sample hive):

Path: \Microsoft\Windows\Registry\RegIdleBackup
URI : Microsoft\Windows\Registry\RegIdleBackup
Task Reg Time : 2020-09-22 14:34:08Z
Task Last Run : 2022-12-11 16:17:11Z
Task Completed: 2022-12-11 16:17:11Z
User   : LocalSystem
Action : {ca767aa8-9157-4604-b64b-40747123d5f2} (%SystemRoot%\System32\regidle.dll)

The code I added does the look up regardless of whether the CLSID is the only entry listed in the Action field, or if arguments are provided, as well. For example:

Path: \Microsoft\Windows\DeviceDirectoryClient\HandleWnsCommand
URI : \Microsoft\Windows\DeviceDirectoryClient\HandleWnsCommand
Task Reg Time : 2020-09-27 14:34:08Z
User   : System
Action : {ae31b729-d5fd-401e-af42-784074835afe} -WnsCommand (%systemroot%\system32\DeviceDirectoryClient.dll)

The plugin also reports if it's unable to locate the CLSID within the Software hive.

So, what this means is that the next time I see a system that's been subject to an attack that includes Scheduled Task abuse, I can check to see if the issue impacts the Software hive as well as the Task XML file, and get a better understanding of the attack, beyond what's available in open reporting.

Finally, I can quickly create plugins based on testing scenarios; for some things, like parsing unallocated space within hive files, this is great for doing tool comparison and validation. However, when it comes to other aspects of DFIR, like extracting and parsing specific data from the Registry, there really aren't many other tools to use for comparison.

Interestingly enough, if you're interested in running something on a live system, I ran across reg_hunter a bit ago; it seems to provide a good bit of the same functionality provided by RegRipper, including looking for null bytes, RLO control characters in key and value names, looking for executables in value data, etc.

Monday, November 28, 2022

Post Compilation

Investigating Windows Systems
It's the time of year again when folks are looking for stocking stuffers for the DFIR nerd in their lives, and my recommendation is a copy of Investigating Windows Systems! The form factor for the book makes it a great stocking stuffer, and the content is well worth it!

Yes, I know that book was published in 2018, but when I set out to write the book, I wanted to do something different from the recipe of most DFIR books to that point, including my own. I wanted to write something that addressed the analysis process, so the book is full of pivot and decision points, etc. So, while artifacts may change over time...some come and go, others become new and change in format over time, others suddenly appear...it's the analysis process that doesn't change.

For example, chapter 4 addresses the analysis of a compromised web server, one that includes a memory dump. One of the issues I've run into over the past couple of years, since well after the book was published, is that there more than a few DFIR analysts who seem to believe that running a text search of a memory dump for IP addresses is "sufficient"; it's not. IP addresses are not often stored in ASCII format; as such, you'd likely want to use Volatility and bulk_extractor to locate the specific structures that include the binary representation of the IP address. As each tool looks for different structures, I recommend using them both...just look at ch 4 of IWS and see how different the information is between the two tools.

There's a lot of really good content in the book, such as "file system tunneling", covered beginning on pg 101. 

While some of the images used as the basis of analysis in the book are no longer available online, several are still available, and the overall analysis process applies regardless of the image.

Analysis
Speaking of analysis processes, I ran across this blog post recently, and it touched on a couple of very important concepts, particularly:

This highlights the risk of interpreting single artefacts (such as an event record, MFT entry, etc) in isolation, as it doesn't provide any context and is (potentially) subject to misinterpretation.

Exactly! When we view artifacts in isolation, we're missing critical factors such as context, and in a great many instances, grossly misinterpreting the "evidence". This misinterpretation happens a lot more than we'd like to think, not due to a lack of visibility, but due to it simply being the DFIR culture.

Another profound statement from the author was:

...instead of fumbling and guessing, I reached out to @randomaccess and started discussing plausible scenarios.

Again...exactly! Don't guess. Don't spackle gaps in analysis over with assumption and speculation. It's okay to fumble, as long as you learn from it. However, most importantly, there's no shame in asking for help. In fact, it's quite the opposite. Don't listen to that small voice insider of you that's giving you excuses, like, "...oh, they're too busy...", or "...I could never ask them...". Instead, listen the roaring Gunnery Sergeant Hartmann (from "Full Metal Jacket") who's screaming at you to reach out and ask someone, Private Joker!!

For me, it's very validating to see others within the industry advocating the same approach I've been sharing for several years. Cyber defense is a team sport folks, and going it alone just means that we, and our customers, are going to come up short.

Tools for Memory Analysis
In addition to the tools for memory analysis mentioned earlier in this blog post, several others have popped over time. For example, here're two:

MemProcFS
ProcMemScan

Now, I haven't tried either one of these tools, but they seem pretty great. 

Additional Resources:
CyberHacktics - Win10 Memory Analysis

Proactive Defense
"Proactive defense" means moving "left of bang", taking steps to inhibit or even obviate the threat actor, before or shortly after they gain initial access. For example, TheHackerNews recently reported on the Black Basta Ransomware gang, indicating that one means of gaining access is to coerce or trick a user into mounting a disk image (IMG) file and launching the VBS script embedded within it, to initially infect the system with Qakbot. Many have seen a similar technique to infect systems with Qakbot, sending ISO files with embedded LNK files. 

So, think about it...do your users require the ability to mount disk image files simply by double-clicking them? If not, consider taking these steps to address this issue; doing so will still allow your users to programmatically access disk image files, but will prevent them from mounting them by double-clicking, or by right-clicking and choosing "Mount" from the context menu. This quite literally cuts the head off of the attack, stopping the threat actor in their tracks. 

Taking proactive security steps...creating an accurate asset inventory (of both systems and applications), reducing your attack surface, and configuring systems beyond the default...means that you're going to have higher fidelity alerts, with greater context, which in turn helps alleviate alert fatigue for your SOC analysts. 

Open Reporting
Lots of us pursue/review open reporting when it comes to researching issues. I've done this more than a few times, searching for unique terms I find (i.e., Registry value names, etc.), first doing a wide search, then narrowing it a bit to try to find more specific information. 

However, I strongly caveat this approach, in part due to open reporting like this write-up on Raspberry Robin, specifically due to the section on Persistence. That section starts with (emphasis added by me):

Raspberry Robin installs itself into a registry “run” key in the Windows user’s hive, for example:

However, the key pointed to is "software\microsoft\windows\currentversion\runonce\". The Run key is very different from the RunOnce key, particularly regarding how it's handled by the OS. 

Within that section are two images, neither of which is numbered. The caption for the second image reads:

Raspberry Robin persistence process following an initial infection and running at each machine boot

Remember where I bolded "user's hive" above? Simply by the fact that persistence is written to a user's hive means that the process starts following the next time that user logs in, not "at each machine boot".

Open reporting can be very valuable during analysis, and can provide insight that an analyst may not have otherwise. However, open reporting does need to be reviewed with a critical eye, and not simply taken at face value.

Sunday, November 27, 2022

Challenge 7 Write-up

Dr. Ali Hadi recently posted another challenge image, this one (#7) being a lot closer to a real-world challenge than a lot of the CTFs I've seen over the years. What I mean by that is that in the 22+ years I've done DFIR work, I've never had a customer pose more than 3 to 5 questions that they wanted answered, certainly not 51. And, I've never had a customer ask me for the volume serial number in the image. Never. So, getting a challenge that had a fairly simple and straight forward "ask" (i.e., something bad may have happened, what was it and when??) was pretty close to real-world. 

I will say that there have been more than a few times where, following the answers to those questions, customers would ask additional questions...but again, not 37 questions, not 51 questions (like we see in some CTFs). And for the most part, the questions were the same regardless of the customer; once whatever it was was identified, questions of risk and reporting would come up, was any data taken, and if so, what data?

I worked the case from my perspective, and as promised, posted my findings, including my case notes and timeline excerpts. I also added a timeline overlay, as well as MITRE ATT&CK mappings (with observables) for the "case".

Jiri Vinopal posted his findings in this tweet thread; I saw the first tweet with the spoiler warning, and purposely did not pursue the rest of the thread until I'd completed my analysis and posted my findings. Once I posted my findings and went back to the thread, I saw this comment:

"...but it could be Windows server etc..so prefetching could be disabled..."

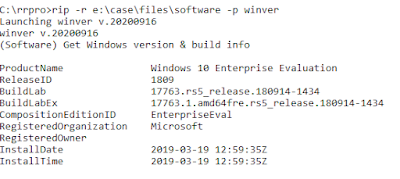
True, the image could be of a Windows server, but that's pretty trivial to check, as illustrated in figure 1.

Fig 1: RRPro winver.pl plugin output


Checking to see if Prefetching is enabled is pretty straightforward, as well, as illustrated in figure 2.

Fig 2: Prefetcher Settings via System Hive


If prefetching were disabled, one would think that the *.pf files would simply not be created, rather than having several of them deleted following the installation of the malicious Windows service. The Windows Registry is a hierarchal database that includes, in part, configuration information for the Windows OS and applications, replacing the myriad configuration and ini files from previous versions of the OS. A lot of what's in the Registry controls various aspects of the Windows eco-system, including Prefetching.

In addition to Jiri's write-up/tweet thread of analysis, Ali Alwashali posted a write-up of analysis, as well. If you've given the challenge a shot, or think you might be interested in pursuing a career in DFIR work, be sure to take a look at the different approaches, give them some thought, and make comments or ask questions.

Remediations and Detections
Jiri shared some remediation steps, as well as some IOCs, which I thought were a great addition to the write-up. These are always good to share from a case; I included the SysInternals.exe hash extracted from the AmCache.hve file, along with a link to the VT page, in my case notes.

What are some detections or threat hunting pivot points we can create from these findings? For many orgs, looking for new Windows service installations via detections or hunting will simply be too noisy, but monitoring for modifications to the /etc/hosts file might be something valuable, not just as a detection, but for hunting and for DFIR work.

Has anyone considered writing Yara rules for the malware found during their investigation of this case? Are there any other detections you can think of, for either EDR or a SIEM?

Lessons Learned
One of the things I really liked about this particular challenge is that, while the incident occurred within a "compressed" timeframe, it did provide several data sources that allowed us to illustrate where various artifacts fit within a "program execution" constellation. If you look at the various artifacts...UserAssist, BAM key, and even ShimCache and AmCache artifacts...they're all separated in time, but come together to build out an overall picture of what happened on the system. By looking at the artifacts together, in a constellation or in a timeline, we can see the development and progression of the incident, and then by adding in malware RE, the additional context and detail will build out an even more complete picture.

Conclusions
A couple of thoughts...

DFIR work is a team effort. Unfortunately, over the years, the "culture" of DFIR has been one that has developed into a bit of a "lone wolf" mentality. We all have different skill sets, to different degrees, as well as different perspectives, and bringing those to bear is the key to truly successful work. The best (and I mean, THE BEST) DFIR work I've done during my time in the industry has been when I've worked as part of team that's come together, leveraging specific skill sets to truly deliver high-quality analysis.

Thanks
Thanks to Dr. Hadi for providing this challenge, and thanks to Jiri for stepping up and sharing his analysis!

Sunday, November 20, 2022

Thoughts on Teaching Digital Forensics

When I first started writing books, my "recipe" for how to present the information followed the same structure I saw in other books at the time. While I was writing books to provide content along the lines of what I wanted to see, essentially filling in the gaps I saw in books on DFIR for Windows systems, I was following the same formula other books had used to that point. At the time, it made sense to do this, in order to spur adoption.

Later, when I sat down to write Investigating Windows Systems, I made a concerted effort to take a different approach. What I did this time was present a walk-through of various investigations using images available for download on the Internet (over time, some of them were no longer available). I started with the goals (where all investigations must start), and shared the process, including analysis decisions and pivot points, throughout the entire process.

Okay, what does this have to do with teaching? Well, a friend recently reached out and asked me to review a course that had been put together, and what I immediately noticed was that the course structure followed the same formula we've seen in the industry for years...a one-dimensional presentation of single artifacts, one after another, without tying them all together. In fact, it seems that many materials simply leave it to the analyst to figure out how to extrapolate a process out of the "building blocks" they're provided. IMHO, this is why we see a great many analysts manually constructing timelines in Excel, after an investigation is "complete", rather than building one from the very beginning to facilitate and expedite analysis, validation, etc.

Something else I've seen is that some courses and presentations address data sources and artifacts one-dimensionally. We see this not only in courses, but also in other presented material, because this is how many analysts learn, from the beginning. Ultimately, this approach leads to misinterpretation of data sources (ShimCache, anyone??) and misuse of artifact categories. Joe Slowik (Twitter, LinkedIn) hit the nail squarely on the head when he referred to IoCs as "composite objects" (the PDF should be required reading). 

How something is taught also helps address misconceptions; for example, I've been saying for sometime now that we're doing ourselves and the community a disservice when we refer to Windows Event Log records solely by their event ID; I'm not the only one to say this, Joachim Metz has said it, as well. The point is that event IDs, even within a single Windows Event Log, are NOT unique. However, it's this reductionist approach that also leads to misinterpretation of data sources; we don't feel that we can remember all of the nuances of different data sources, and rather than looking to additional data sources on which to build artifact constellations and verification, we reduce the data source to the point where it's easiest to understand.

So, we need a new approach to teaching this topic. Okay, great...so what would this approach look like? First, it would start off with core concepts of validation (through artifact constellations), and case notes. These would be consistent throughout, and the grade for the final project would be heavily based on the existence of case notes.

This approach is similar to the Dynamics mechanical engineering course I took during my undergraduate studies. I was in the EE program, and we all had to "cross-pollinate" with both mechanical and civil engineering. The professor for the Dynamics course would give points for following the correct process, even if one variable was left out. What I learned from this was that trying to memorize discrete facts didn't work as well as following a process; it was more correct to follow the process, even if one angular momentum variable was left out of the equation. 

The progression of this "new" course would include addressing, for example, artifact categories; you might start with "process execution" because it's a popular one. You might build on something that persists via a Run key value...the reason for this will become apparent shortly. Start with Prefetch files, and be sure to include outlier topics like those discussed by Dr Ali Hadi. Be sure to populate and maintain case notes, and create a timeline from the file system and Prefetch file metadata (embedded time stamps)...do this from the very beginning.

Next, go to Windows Event Logs. If the system has Sysmon installed, or if Process Tracking is enabled (along with the Registry mod that enables full command lines) in the Security Event Log, add those records to the timeline. As the executable is being launched from a Run key (remember, we chose such an entry for a reason, from above), be sure to add pertinent records from the Microsoft-Windows-Shell-Core%4Operational.evtx Event Log. Also look for WER or "Application Popup" (or other errors) that may be available from the Application Event Log. Also look for indications of malware detections in logs associated with AV and other monitoring tools (i.e., SentinelOne, Windows Defender, Sophos, WebRoot, etc.). Add these to the timeline.

Moving on to the Registry, we clearly have some significant opportunities here, as well. For example, looking at the ShimCache and AmCache.hve entries for the EXE If available), we have an opportunity clearly demonstrate the true nature and value of these artifacts, correcting the misinterpretations we so often see when artifacts are treated in isolation. We also need to bring in additional resources and Registry keys, such as the StartupApproved subkeys, etc.

We can then include additional artifacts like the user's ActivitiesCache.db, SRUM.db, etc., artifacts, but the overall concept here is to change the way we're teaching, and ultimately doing DF work. Start with a foundation that requires case notes and artifact constellations, along with an understanding of how this approach leads and applies to validation. Change the approach by emphasizing first principles from the very beginning, and keeping them part of the education process throughout, so that it becomes part of the DFIR culture.

Monday, November 14, 2022

RegRipper Value Proposition

I recently posted to LinkedIn, asking my network for their input regarding the value proposition of RegRipper; specifically, how is RegRipper v3.0 of "value" to them, how does it enhance their work? I did this because I really wanted to get the perspective of folks who use RegRipper; what I do with RegRipper could be referred to as both "maintain" and "abuse". Just kidding, but the point is that I know, beyond the shadow of a doubt, that I'm not a "typical user" of RegRipper...and that's the perspective I was looking for.

Unfortunately, things didn't go the way I'd hoped. The direct question of "what is the value proposition of RegRipper v3.0" was not directly answered. Other ideas came in, but what I wasn't getting was the perspective of folks who use the tool. As such, I thought I'd try something a little different...I thought I'd share my perspective.

From my perspective, and based on the original intent of RegRipper when it was first released in 2008, the value proposition for RegRipper consists of:

Development of Intrusion Intel
When an analyst finds something new, either through research, review of open reporting, or through their investigative process, they can write a plugin to address the finding, and include references, statements/comments, etc.

For example, several years ago, I read about Project Taj Mahal, and found it fascinating how simple it was to modify the Registry to "tell" printers to not delete copies of printed jobs. This provides an investigator the opportunity to detect a potential insider threat, just as much as it provides a threat actor with a means of data collection. I wrote a plugin for it, and now, I can run it either individually, or just have it run against every investigation, automatically.

Extending Capabilities
Writing a plugin means that the capabilities developed by one analyst are now available to all analysts, without every analyst having to experience the same investigation. Keep in mind, as well, that not all analysts will approach investigations the same way, so one analyst may find something of value that another analyst might miss, simply because their perspectives and backgrounds are different.

Over the years, a number of folks in the community have written plugins, but not all of them have opted to include those plugins in the Github repo. If they had, another analyst, at another organization, can run the plugin without ever having to first go through an investigation that includes those specific artifacts. The same is true within a team; one analyst could write a plugin, and all other analysts on the team would have access to that capability, without having to have that analyst there with them, even if that analyst were on PTO, parental leave, or had left the company. 

As a bit of a side note, writing things like RegRipper plugins or Yara rules provides a great opportunity when it comes to things like performance evaluations, KPIs, etc.

Retention of "Corporate Knowledge"
A plugin can be written and documented (comments, etc.) such that it provides more than just the basic information about the finding; as such, the "corporate knowledge" (references, context, etc.) is retained and available to analysts, even when the plugin author is unavailable. The plugin can be modified and maintained across versions of Windows, if needed.

All of these value propositions lead to greater efficiency, effectiveness and accuracy of analysts, providing greater context and letting them get to actual analysis faster, and overall reducing costs. 

Now, there are other "value propositions" for me, but they're unique to me. For example, all I need to do is consult the CPAN page for the base module, and I can create a tool (or set of tools) that I can exploit during testing. I've also modified the base module, as needed, to provide additional information that can be used for various purposes.

I'm still very interested to understand the value proposition of RegRipper to other analysts.

Monday, October 31, 2022

Testing Registry Modification Scenarios

After reading some of the various open reports regarding how malware or threat actors were "using" the Registry, manipulating it to meet their needs, I wanted to take a look and see what the effects or impacts of these actions might "look like" from a dead-box, DFIR perspective, looking solely at the Registry.  I wanted to start with an approach similar to what I've experienced during my time in IR, particularly the early days, before EDR, before things like Sysmon or enabling Process Tracking in the Security Event Log. I thought that would be appropriate, given what appears to be the shear number of organizations with limited visibility into their infrastructures. For those orgs that have deployed Sysmon, the current version (v14.1) has three event IDs (12, 13, and 14) that pertain to the Registry.

The first scenario I looked at was from this Avast write-up on Raspberry Robins's Roshtyak component; in the section titled "Indirect registry writes", the article describes the persistence mechanism of renaming the RunOnce key, adding a value, then re-renaming the key back to "RunOnce", apparently in an effort to avoid rules/filters that look specifically for values being added to the RunOnce key. As most analysts are likely aware, the purpose of the RunOnce key is exactly that...to launch executables once. When the RunOnce key is enumerated, the value is read, deleted, and the executable it pointed to is launched. In the past, I've read about malware executables that are launched from the RunOnce key, and the malware itself, once executed, will re-write a value to that key, essentially allowing the RunOnce key and the malware together to act as if the malware were launched from the Run key.

I wanted to perform this testing from a purely dead-box perspective. Using EDR tools, or relying on the Windows Event Logs. Depending upon your configuration, you could perhaps look to the Sysmon Event Log, or if the system had been rebooted, you could also look to the Microsoft-Windows-Shell-Core%4Operational.evtx Event Log and Events Ripper to percolate unusual executables.

For reference, information on the Registry file format specification can be found here.

Methodology
The first thing I did was use "reg save" to create a backup of the Software hive. I then renamed the RunOnce key, and added a value (i.e., "Calc"), and renamed the key back to "RunOnce", all via RegEdit. I then closed RegEdit and used "reg save" to create a second copy of the Software hive. I then opened RegEdit, deleted the value, and saved a third copy of the Software hive.

During this process, I did not reboot the system; rather, I 'simulated' a reboot of the system by simply deleting the added value from the RunOnce key. Had the system been rebooted, there would likely be an interesting event record (or two) in the Microsoft-Windows-Shell-Core%4Operational.evtx Event Log.

Finally, I created a specific RegRipper plugin to extract explicit information about the key from the hive file.

First Copy - Software
So, again, the first thing I wanted to do was create a baseline; in this case, based on the structure for the key node itself. 

Fig 1: Software hive, first copy output


Using the API available from the Perl Parse::Win32Registry module, I wrote a RegRipper plugin to assist me in this testing. I wanted to get the offset of the key node; that is, the location within the hive file for the node itself. I also wanted to get both the parsed and raw information for the key node. This way, I could not only see the parsed data from within the structure of the key node itself, but I could also see the raw, binary structure, as well.

Second Copy - Software2
After renaming the RunOnce key, adding a value, and re-renaming the key back to "RunOnce", I saved a second copy of the Software hive, and ran the runonce_test.pl plugin to retrieve the information illustrated in figure 2.

Fig 2: Plugin output, second copy, Software hive


We can see between figures 1 and 2 that there are no changes to the offset, the location of the key within the hive file itself. In fact, the only changes we do see are the LastWrite time (which is to be expected), and the number of values, which is now set to 1.

Third Copy - Software3
The third copy of the Software hive is where I had deleted the value that had been added. Again, this was intended to simulate rebooting the system, and did not account for the malware adding a reference to itself back to the RunOnce key once it was launched.

Figure 3 illustrates the output of the plugin run against the third copy of the Software hive.

Fig 3: Plugin output, third copy, Software hive


Again, the offset/location of the key node itself hasn't changed, which is to be expected. Deleting the value changes the number of values to "0", and adjusts the key LastWrite time (which is to be expected). 

I then ran the del.pl plugin (to get deleted keys and values from unallocated space within the hive file) against the third copy of the Software hive, opened the output in Notepad++, searched for "calc", and found the output shown in figure 4 below. I could have used regslack, from Jolanta Thomassen (go here to see Jolanta's thesis from 2008), but simply chose the RegRipper plugin because I was already using RegRipper.

Fig 4: Del.pl output from third copy, Software hive


Unfortunately, value nodes contain neither time stamps, nor a reference back to the original key node (parent key offset) to which they were a member, as described in sections 4.1.1 and 4.1.2 of the Registry file format specification for key nodes; value node structures are described in sections 4.4.1 and 4.4.2. 

Conclusion
As we can see from this testing, there's not much that we can see just from the Registry hive file that would lead us to believe that anything unusual had happened. While we might have an opportunity to see something of this activity via the transaction logs, that would depend a great deal upon how long after the activity that the incident was discovered, the amount of usage on the system, etc. It appears that the way this specific activity would be discerned would be through a combination of malware RE, EDR, Windows Event Log records, etc.

Next, I'll take a look at at least one of the scenarios presented in this Microsoft blog post.

Addendum, 1 Nov: Maxim Suhanov reached to me about running "yarp-print --deleted" to get a different view of deleted data within the hive, and I found some anomalous results that I simply cannot explain. As a result, I'm going to completely re-run the tests, fully documenting each step, and providing the results again.

Tuesday, October 18, 2022

Data Collection

During IR engagements, like many other analysts, I've seen different means of data exfiltration. During one engagement, the customer stated that they'd "...shut off all of our FTP servers...", but apparently "all" meant something different to them, because the threat actor found an FTP server that hadn't been shut off and used it to first transfer files out of the infrastructure to that server, and then from the server to another location. This approach may have been taken due to the threat actor discovering some modicum of monitoring going on within the infrastructure, and possibly being aware that FTP traffic going to a known IP address would not be flagged as suspicious or malicious.

During another incident, we saw the threat actor archive collected files and move them to an Internet-accessible web server, download the archives from the web server and then delete the archives. In that case, we collected a full image of the system, recovered about a dozen archives from unallocated space, and were able to open them; we'd captured the command line used to archive the files, including the password. As a result, we were able to share with the customer exactly what was taken, and this allowed us to understand a bit more about the threat actor's efforts and movement within the infrastructure.

When I was first writing books, the publisher wanted me to upload manuscripts to their FTP site, and rather than using command line FTP, or a particularly GUI client utility, they provided instructions for me to connect to their FTP site via Windows Explorer. What I learned from that was that the evidence of the connection to the FTP site appeared my shellbags. Very cool. 

Okay, so those are some ways to get data off of a system; what about data collection? What are some different ways that data can be collected?

Clipboard
Earlier this year, Lina blogged about performing clipboard forensics, which is not something I'd really thought about (not since 2008, at least), as it was not something I'd ever really encountered. MITRE does list the clipboard as a data collection technique, and some research revealed that some malware that targets crypto wallets will either get the contents of the clipboard, or replace the contents of the clipboard with their own crypto wallet address. 

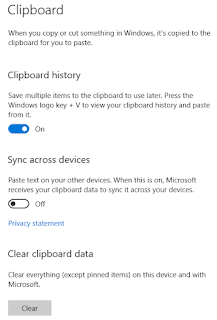
Perl has a module for interacting with the Windows clipboard, as do other programming languages, such as Python. This makes it easy to interact with the clipboard, either extracting data from it, or 'pasting' data into it. You can view the contents of the clipboard by hitting "Windows Logo + V" on your keyboard.

Fig 1: Clipboard Settings
But, wait...there's more! More recent versions of Windows allow you to not only enable a clipboard history, maintaining multiple items in your clipboard, but also sync your clipboard across devices! So, if you have a Windows account, you can sync the clipboard contents across multiple devices, which is an interesting means of data exfiltration! 

Both of these settings manifest as Registry values, so they can be queried or even set (by threat actors, if the user hasn't already done so). For example, a threat actor can enable the clipboard history 

Digging into Lina's blog post led me to this ThinkDFIR post on "Clippy history", and just like it says there, once the clipboard history is enabled, the %AppData%\Microsoft\Windows\Clipboard folder is created. Much like what the ThinkDFIR post describes, if the user pins an item in their clipboard, additional data is created in the Clipboard folder, including JSON files that contain time stamps, all of which can be used by forensic analysts. The contents of the files themselves that contain the saved data are encrypted, however...there does seem to be (from the ThinkDFIR post comments) a tool available for decrypting and viewing the contents, but I haven't tried it.

Suffice to say that while the system is active, it's possible to have malware running via an autostart location or as a scheduled task, that can retrieve the contents of the clipboard as a data collection technique. Lina pointed out another means of performing clipboard "forensics"; beyond memory analysis, parsing the user's ActivitiesCache.db file may offer some possibilities.

Additional Resources
Cellebrite - Syncing Across Devices - Logging into multiple systems using the same Microsoft ID
ForensicFocus - An Investigator's Goldmine

Fig 2: Printer Properties Dialog
Printers And KeepPrintedJobs
Another means for collecting data to gain insight into an organization is by setting printers to retain copies of print jobs, rather than deleting them once the job is complete. This is a particularly insidious means of data collection, because it's not something admins, analysts, or responders usually check for, as even for some of us who've been in the industry for some time, the general understanding is the print jobs are deleted by default, once they've completed.

We say, "can be used", but has it been? According to MITRE, it has, by a group referred to as "TajMahal". This group has been observed using the Modify Registry technique as a means of data collection, specifically setting the KeepPrintedJobs attribute via the Registry. The printer properties dialog is visible in figure 2, with the KeepPrintedJobs attribute setting highlighted. 

While there isn't a great deal of detail around the Tah Mahal group's activities, Kaspersky mentioned their capability for stealing data in this manner in April 2019. The story was also picked up by Wired.comSecureList and Schneier on Security.

Fig 3: Print Job Files
The spool (.spl) and shadow (.shd) files are retained in the C:\Windows\System32\spool\PRINTERS folder, as illustrated in figure 3. The .spl file is an archive, and can be opened in archive tools such as 7-Zip. Within that archive, I found the text of the page I'd printed out (in my test of the functionality) in the file "Documents\1\Pages\1.fpage\[0].piece" within the archive.

I did some quick Googling for an SPL file viewer, more out of interest rather than wanting to actually do so. I found a few references, including an Enscript from OpenText, but nothing I really felt comfortable downloading.

Conclusion
There are more things in heaven and earth, dear reader, than are dreamt of in your philosophy...or your forensics class. As far as data collection goes, there are password stealers like Predator the Thief that try to collect credentials from a wide range of applications, and then there's just straight up grabbing files, including PST files, contents of a user's Downloads folder, etc. But then, there are other ways to collect sensitive data from users, such as from the clipboard, or from files they printed and then deleted...and thought were just...gone. 

Saturday, October 15, 2022

Events Ripper

Not long ago, I made a brief mention of Events Ripper, a proof-of-concept tool I wrote to quickly provide situational awareness and pivot points for analysts who were already on the road to developing a timeline. The idea behind the tool is that artifacts are compound objects, and have value based not just on their time stamps, their value can also be predicated on the analysis questions or goals, or just the nature of their path, or some other factor. 

The tool leverages the fact that analysts are already creating timelines, and uses the intermediate events file format to develop situational awareness and pivot points to facilitate analysis. Many times, we're looking through a timeline for some root cause or predicating event, but we're dealing with the fact that there was some normal system behavior (such as an update) that's caused a large number of events to be generated.

At the moment, the available plugins target Windows Event Log data, in many cases producing output similar to what analysts are used to seeing in ShimCache or AmCache parser output. So, of course, the output of the various plugins are going to depend upon the Windows Event Logs you've included in the timeline, as well as how long it's been since the activity in question occurred (i.e., logs roll over), and what specifically is being audited (although that pertains more to the Security Event Log). Further, they're doing to also depend upon what's being logged, something you can check via the auditpol.exe native utility (or the auditpol.pl RegRipper plugin). For example, I've once saw a Security Event Log with over 35,000 records, and they were all successful logins. Yep, that's it...just successful logins, and because of the nature of the system, most of them were type 3 logins...which is why I wrote a plugin to just get a count of logins by type, so that it's easy to see this information about your data quickly.

That's one of the keys to this tool...to be able to quickly and easily distill and discern some important insight about the data that you have from a system. As such, the real value of this tool comes from analysts using it, exploring it, and asking questions, talking about how to view and manage the data they have. 

Tools like this are especially useful in diverse environments where you are likely to encounter data sources with disparate content, such as consulting environments. During my time in consulting, I never...never...saw two identical environments. Ever organization is different. In fact, it wasn't unusual to find different application loads and audit configurations between departments, or sometimes even within the same department. So when you find something new, you create a plugin to parse it out and provide context, because you never know when you, or another analyst on your team, is going to see it, or something like it, again.

Another key value indicator of this tool is corporate knowledge retention. For example, our team worked an incident were we saw a Windows Defender event with event ID 2051; I'd never seen such an event record before (and haven't since), and no one else had any information about such an event record. So, after researching it, I wrote a plugin, so that what we learned about such an event is now available to every analyst who uses the tool, regardless of whether or not they're on our team. The same is true with respect to the hitman.pl plugin; we saw via the Application Event Log that the customer had had the Sophos HitmanPro product installed at one point (the Windows Event Logs also showed that it had been removed), and that the product had alerted on the file we were interested in, demonstrating that the file existed on the system for some time prior to the incident time frame.

Something else that a few analysts are familiar with is that Application Event Log records can often contain references to malicious software, in DCOM errors, Application Hang event records, and Windows Error Reporting event records. As such, I wrote plugins for each of these event records that lists the impacted applications in a format similar to what's seen in ShimCache or AmCache parser output. 

How To Use It
Here's example output from the ntfs.pl plugin:

D:\erip>erip -f g:\ntfs_events.txt -p ntfs
Launching ntfs v.20221010

Get NTFS volumes

System name: enzo

Mounted Volumes:
C:\ -  WDC WD5000BEKT-75KA9T0
D:\ -  WDC WD5000BEKT-75KA9T0
F:\ - Msft     Virtual Disk
F:\ - WD       My Passport 0741
F:\ - WD       My Passport 25E2
G:\ - SanDisk  Cruzer

Analysis Tip: Microsoft-Windows-Ntfs/145 events provide a list of mounted volumes.

From the above output, we can see that the C:\ and D:\ drives (the system named "enzo" has one hard drive split into two volumes), but we can also see other drive letters listed, along with their associated friendly names. We can likely find similar information in the Registry, and I'd definitely want to include that info, as well, but this is immediate, valuable insight from a limited data source, as I can quickly see drive letter mappings. However, I do need to keep in mind that this information may not be complete, but it's a good start.

Here's example output from the mount.pl plugin:

D:\erip>erip -f g:\vhd_events.txt -p mount
Launching mount v.20221010
Get VHD[X]/ISO files mounted

System name: Stewie

Files mounted (VHD[X], ISO):
D:\test\iso\b91c8f5adb81a262b2b95e2bf85fd7170e100885600af1f9bde322f10ac0e800.iso
D:\test\billid0574.iso
D:\test\iso\test.iso

Analysis Tip: Microsoft-Windows-VHDMP/1 events provide a list of files mounted or "surfaced".

Let's say that you look at the above output and think, "I want to see a timeline of all instances where 'test.iso' was involved"; well, that's easy enough to do, in a few simple steps:

type g:\vhd_events.txt | find "test.iso" > g:\iso_events.txt
parse -f g:\iso_events.txt > g:\tln.txt

Now, you have a timeline of all of the events that include "test.iso".

Interestingly enough, the above output is from one of my own systems, and once I saw it, I checked the values within the RecentDocs/.iso Registry key and found all three of those ISO files listed.

Using the two above plugins, I'm able to get a quick look at drive mappings for devices, as well as mounted ISO files, with minimal effort.

So What?
So, why does any of this matter? Red Canary recently shared some open reporting on Raspberry Robin, where they stated that this malware was spread via infected thumb drives. However, they also stated that there were "several intelligence gaps around this cluster", mentioning one of these gaps. Note that Cisco Talos also reports that Raspberry Robin spreads via "external drives"; however, Cybereason indicates that it could be "removable devices or ISO files". I'm not suggesting that this is a disparity in primary sources, but rather that it's pretty straightforward to gather insight and some solid answers based solely on one or two Windows Event Log files.

Conclusion
Tools like this provide for:

- Creating situational awareness and "pivot points" from your incident data
- Creating context and insights from your incident data
- Corporate knowledge retention, particularly for diverse environments, such as you find with consulting
- An alternate/additional means for analysts of all levels to contribute
- Fully exploiting limited data sets

However, tools like this (and timelines, as well) are limited by:

- Which Windows Event Logs are included
- The applications installed on the system
- The audit policy of the system
- How long it's been since the incident occurred


Wednesday, October 12, 2022

We Need Cybersecurity Mentors

I received a job description from a recruiter recently, along with the request that if I knew anyone who fit the bill and was interested, could I please forward the job description to them. The recruiter was looking for someone at an entry-level, with 1 - 3 yrs of experience, and the listed salary was for a low six-figure salary.

However, the list of Essential Skills were (copy-paste, with a few modifications):

- Practical mobile phone forensic analyst skills on hardware and software.
- Ability to run network and sandbox analysis on Windows, Linux, Mac, Android, iOS, and other platforms.
- Ability to use compliers[sic] and other software analytical tools for different platforms.
- Strong in tools such as <list of tools> and other analysis tools.
- Strong TCP/UDP/IP networking and protocol understanding, how they work, what they do, and what ports they use.
- Strong communication skills to relate findings in an understandable and useful way.
- Strong self-disciplined and self-starter that can think outside of the box and bring fresh insight and experience to the team.
- Comfortable with Linux shell and common GNU utilities.
- Ability to analyze, summarize, visualize, and detect anomalies from raw network communications data in a clear and effective manner.

Yeah, okay. I saw it, too. 

First, "1 - 3 yrs" of experience, entry-level, but "Essential Skills" for the role cover mobile (hardware *and* software), Windows, Linux, Mac, Android, iOS, and "other platforms".

Then, the applicant needs to understand TCP, UDP, IP, and "the ports they use".

Yes, there was a misspelling.

The last thing I'll mention is that, again, this is an entry-level position, but looking to "bring fresh insight and experience to the team". If someone is entry-level, what *experience* are they bringing to the team?

Okay, just to be clear...this is NOT a post to bash the job description...not at all. I'm not interested in calling anyone out, or putting anyone on the spot. All of the above is meant solely to let others know, yes, I'm seeing the same things and having similar thoughts as you are, so you're not alone in that sense.

What this post is to say is that when someone who's entry-level, someone with 1 - 3 yrs of experience in the field sees a job description such as this, they're going to immediately look at it and not apply. "But...why", you ask? Because there's no way you're going to be able to fulfill the stated "essential skills" with under 3 yrs of experience. Even folks looking at this description with a dozen years of experience are going to know that you're not going to be able to attain an "essential" level of all of these skills.

Ultimately, what's going to come of job descriptions such as this will be continued, circular reporting on how there aren't enough skilled people in the industry to fill all of the open positions.

But there is a solution! If' you're new to the cybersecurity field and thinking about looking around for a new role, or if you're looking to get into the field, even as a transitioning veteran...find a mentor. Find someone you trust, someone you can engage with to help you navigate the myriad twists and turns of the maze. Find someone with more experience who can help you navigate job descriptions, certifications, etc., or even just help you figure out which area of "cybersecurity" might be the most interesting to you. 

Finding a mentor can help you get over what might be preventing or dissuading you from applying for the above described role. As an example, my reaction to the job description was to respond to the email, saying, "...I'm sorry, but this makes no sense to me...", and why. I wasn't expecting a response, but I did get one. The recruiter shared that they were most interested in filling an entry-level role, and the message was that the "essential skills" really weren't so "essential". As a result, I'd come back with the message, "yes, go ahead and apply."

So, again...getting into the cybersecurity field can be daunting. Wait...no, I take that back. Not "can be"...is. It is daunting. There are so many options, so many opportunities, and the best way to go about deciphering and unraveling the process of getting into the field is to engage with someone who's already done it. If you're new to the field...a student, a transitioning vet, or if you're transitioning careers...reach out, engage, and find yourself a mentor. 

Monday, October 10, 2022

Post Compilation

For this post, I'll throw out a bunch of little snippets, or "post-lets", covering a variety of DFIR topics rather than one big post that covers one topic.

What's Old Is New Again
During Feb, 2016, Mari published a fascinating blog post regarding the VBAWarnings value. That was a bit more than 6 1/2 yrs ago, which in "Internet time" is several lifetimes. 

Just this past September, Avast shared a write-up of the Roshtyak component of Raspberry Robin, where they described some of the techniques used by this malware, including checking the VBAWarnings value as a means of "detecting" virtual or testing environments.

Getting PCAPs
When I've been asked on-site (or remotely), it's most often been after an incident has happened. However, that doesn't mean that I shouldn't have a means available for myself, or to share with IT admins, to collect pcaps. Having something like this readily available can be very beneficial, when you need it.

It seems that Windows 10 and above comes with a native tool for collecting network traffic data called pktmon.

Prefer Powershell? Doug Metz over at BakerStreetForensics has a solution for you.

I've used bulk_extractor to get pcaps from memory dumps; because this uses a different means for identifying network connections than Volatility, running them both is a really, REALLY good idea! So good, as a matter of fact, that I included an example of this in Investigating Windows Systems, which just shows that regardless of the version of Windows you're dealing with, the process still holds up.

Memory Analysis
Or, if you're looking for a bit more, consider bulk_extractor with record carving.

Also, if you're doing memory analysis, you might consider tools such as MemProcFS and MemProcFS-Analyzer. While I'm not a fan of a lot of the available GUI tools that folks (generally) use for analysis, this tweet from "evild3ad79" makes visualizing processes so much easier!

MOTW
MOTW, or "mark-of-the-web" is a pretty hot topic, as it should be. "MOTW" is the NTFS alternate data stream, or "ADS", attached to files downloaded from the Internet, and something we've seen expand over time. At first these were simply "zone identifier" ADSs, and contained just that...the "zone" for the downloaded file. We first saw these associated with files downloaded via IE and Outlook, and then later saw MOTW attached to files downloaded via other browsers. 

MOTW picked up steam a bit after MS announced that they were going to change the default behavior of systems running macros in Office documents downloaded from the Internet. We then saw some actors move to using archives rather than "weaponized" Office documents, and our attention shifted to archive utilities and MOTW propagation

For a bit of a different perspective on MOTW, Outflank published this article discussing MOTW from a red team perspective.

And, to top it all off, MS has shared information regarding how to disable the functionality (of attaching MOTW). What this does provide is an excellent opportunity for detections, both in the SOC (adding or modifying the SaveZoneInformation value) and for DFIR (checking the value).

Web Shells
Many, many moons ago (circa 2007, 2008), Chris Pogue and I were addressing investigating SQL Injection and web shells for the IBM ISS X-Force ERS team, codifying (or trying to) some basic processes for locating these attacks in a reactive, DFIR mode. We had a lot of different approaches, all of which could be addressed programmatically...things such as the first instance of a page being requested (across the history of the web server logs that you have available), the number of times a page was requested, the length of the request sent to the page, User Agents, etc. Now, all of these depended upon which fields were actually being logged, so we started with the default IIS logging fields and attempted to modify and address things from there. This way, encountering IIS logs with the fields having been modified (hopefully, added to...) or non-IIS web servers were considered "one-offs", and we found that the approach worked well. 

I learned recently that Aaron Shelmire authored a blog on this topic for Anomali; this was a great finding, not just because it lists some of the things we'd looked for, but also because Aaron and I worked together at one point. It's great to see contributions like this within the community.

Events Ripper
Not long ago, I released Events Ripper, a proof-of-concept tool based on RegRipper, in that it relies on plugins to extract and present data. The idea behind Events Ripper is to leverage what analysts are already doing to provide situational awareness and pivot points for analysis. So, when analysts are performing timeline creation (and moving to timeline analysis), they can leverage the events file they've already created to obtain insight into the system.

At this point, all of the Events Ripper plugins are based on data in an events file, from parsed Windows Event Logs (via wevtx.bat). For example, I wrote two plugins recently, mount.pl and ntfs.pl, that analysts can use to verify initial access used by Raspberry Robin; mount.pl runs through the events file looking for Microsoft-Windows-VHDMP/1 events indicating that a disk was "surfaced", and outputs a list of the VHD[X] and/or ISO files. Ntfs.pl looks for Microsoft-Windows-Ntfs/145 events to locate volumes, and map them to the drives or devices. Using these two plugins, you can get some quick insight as to how Raspberry Robin (or other malware) may have originally made it on to the system...via a USB thumb drive or ISO file delivered as an email attachment.

Interestingly enough, when I was developing and testing the mount.pl plugin, the Microsoft-Windows-VHDMP/Operational.evtx log file from my test system contained three ISO files. Checking the RecentDocs/.iso values in the Registry, I found those same three files listed, as well. 

Per a request from my esteemed co-worker Dray, all of the plugins display the system name, or names, as the case may be. It's not unusual for systems to start out as a gold image and be renamed, so you may have event records that still contain the original system name.

Thursday, October 06, 2022

Speaking Engagements

Every now and again, I have a need (re: "opportunity") to compile a list of recorded speaking events. The reasons vary...there's a particular message in one or more of the recordings, or someone wants to see/hear what was said, or it's more about showing examples of my presentation style. For the sake of simplicity, I thought I'd just take the list I'd compiled in Notepad++ and create a blog post.

Huntress TradeCraft Tuesdays
Bang For Your Buck: How Hackers Make Money - Ethan and I discuss various means by which threat actors monetize their activities, which is (in many cases) their ultimate goal. We also present some steps you can take to inhibit or obviate this.

Digital Forensics (or Necromancy) - Jamie and I talk about digital forensics with our special guest, Dr. Brian Carrier

ResponderCon 
Here's a link to my slides; I'll post a link to the recorded talk once it's available.

Update, 7 Nov: They're here! The video for my presentation can be found here.

Podcasts
I recently participated in the Horangi "Ask A CISO" podcast (link here, and on Spotify).

Older Events/Recordings
RVASec 2019 presentation
Nuix Unscripted
A couple of podcasts via OwlTail
Down the Security Rabbithole podcast from 2017
A podcast from 2009
CyberSpeak podcast from 2006 (24 Sept, 1 Apr)

Update, 27 Jan 2023: I appeared on the Future of Cyber Crime podcast with the wonderful Zaira Pirzada as the hostess! Thanks, Zaira, for the opportunity!

Update, 2 Feb 2023: Here's the video for the Future of Cyber Crime podcast.