This whole "timeline analysis" thing is getting a little bit of play, it seems. Yeah, I know, I've been on my soapbox about it here and here, and even Rob Lee got into the mix on the SANS Forensic blog, as well. This is a good thing...timeline analysis, when it comes to digital forensics, can be extremely important. Timelines can be about who did what, when, or they can be about what happened when, on what system (or from which system did it originate?). Either way, timelines can do a great deal to answer questions.
From what I've seen, and done, most analysts seem to be taking something of a manual approach to timeline generation; finding "important" events and adding them manually to a spreadsheet. This is fine, but there are drawbacks. First, it's not entirely scalable. Second, as you start adding sources beyond file system data, you start adding complexity and time to the equation. In commercial consulting, time is money. For LE work, time is backlog. There's got to be a better way...seriously.
As a recap, some of where this originates is with Brian Carrier's TSK tools. Brian has some info on timelines here, in which he discusses using the "fls" tool to create a body file, which can then be parsed by mactime or ex-tip. This data can also be graphically displayed via Zeitline (note: Zeitline hasn't been updated since June, 2006). The TSK tools are fantastic for what they do, but maybe what needs to be done is to take the output of fls to the next level.
Now, something that folks (Mike, with ex-tip, and Rob, via SIFT) have done is to include Registry hive files in the timeline analysis, following the same sort of body file format as is used by fls...after all, Registry key LastWrite times are analogous to file last written/modified times. However, there are some potential shortcomings with this approach, the most notable of which is that you'll get a LOT of data that you're simply not interested in if you're getting all keys and their LastWrite times from a hive file; many of the keys within the Registry that may be modified during the course of normal operations may not be of interest to the analyst. Also, simply displaying a Registry key's LastWrite time can have little to no context regarding what actually happened; this is especially true with MRU lists. This is pretty easy to overcome, though, by adding the ability to write timeline data to RegRipper.
Okay, but what about the other sources mentioned? What about Event Logs? Event Log records may be important, but they generally don't fit the model used for the body file. Evt2Xls has been updated (after this tool was copied to the WFA 2/e master DVD and sent to the publisher) to write out the information that is necessary for timeline analysis. Other tools can also be included through the use of import filters, which is the direction Mike Cloppert went with ex-tip. However, as we start adding sources (log files, EVT files, Registry hives, network captures, etc.) we need to add additional information to our "events" so that we can differentiate items such as sources, hosts, users, etc.
As I see it, there are essentially 5 different fields that define a timeline event:
Time - MS systems use 64-bit FILETIME objects in many cases; however, for the purposes of normalization, 32-bit Unix epoch times will work just fine
Source - fixed-length field for the source of the data (i.e., file system, Registry, EVT/EVTX file, AV or application log file, etc.) and may require a key or legend. For graphical representation, each source can be associated with a color.
Host - The host system, defined by IP or MAC address, NetBIOS or DNS name, etc. (may also require a key or legend)
User - User, defined by user name, SID, email address, IM screenname, etc. (may also require a key or legend)
Description - The description of what happened; this is where context comes in...
Now, for the purposes of data reduction, we can also define a sixth field, called "Type". There are essentially two types of events; point or span. Point events have a single time associated with them, span events (i.e., AV scans) have a start and end time associated with them. As there are only two, this can be a binary value (a 1 or a 0). However, maybe this is getting a bit ahead of myself; what I was thinking is that I've had a number of examinations where many files in the system32 directory have had their last access times modified to within a 3 min range, and reviewing the AV application logs, an AV scan had been run at that time.
Now, one thing about the five fields is that they won't all be filed in by the available data, all the time. For example, when parsing Event Logs, there may be a user identifier (SID) in the data, but there may not be host or system information available. Also, the source field will most likely always need to be filled in by either the analyst or the filter. This isn't really a problem, because when it comes to an actual timeline, all you really need is the time (or start and end times) and a description of the event, which can include things such as host and system fields. But one thing to remember is what this is all really about is data reduction and representation; having fields to parse on can let you narrow down activity. For example, if you suspect that a particular user was involved in an incident, you can parse your data based on your user...either by username, SID, or as user's of Analyst's Notebook may be familiar with, email address.
One of the main issues with this is that analysts need to be aware of what they can do...don't discount doing something just because there doesn't seem to be an easily available means to do it right now. Timeline analysis is an extremely valuable tool to use, and the first step is to recognize that fact.
Resources
Geoff Black's CEIC 2007 presentation on timeline analysis
TimeMap Timeline Software (LexisNexis)
Lance's Windows Event Log post
Addendum: After posting, I finished updating evt2xls.pl, adding the capability to print to .csv as well as to a timeline (.tln) format. The .tln format looks like this:
1123619815|EVT|PETER||crypt32/2;EVENTLOG_INFORMATION_TYPE;http://www.download.windowsupdate.com/msdownload/update/v3/static/trustedr/en/authrootstl.cab
1123619816|EVT|PETER|S-1-5-21-839522115-1801674531-2147200963-1003|MsiInstaller/11707;EVENTLOG_INFORMATION_TYPE;Product: Windows Genuine Advantage v1.3.0254.0 -- Installation completed successfully. (NULL) (NULL) (NULL)
1123619888|EVT|PETER|S-1-5-18|Userenv/1517;EVENTLOG_WARNING_TYPE;PETER\Harlan
1125353382|EVT|PETER||VMTools/105;EVENTLOG_INFORMATION_TYPE;
What we see here is 4 entries from a parsed Application Event Log file. There are essentially 5 fields, all pipe ("|") separated. The format looks like this:
Time|Source|Host|User|Description
Again, the Time value is normalized to 32-bit Unix epoch time, and is the Time Generated field from the event record (there is also a Time Written field). What this does is allow an analyst to specify a time window, and then search a file (or several files) for all events that fall within that window; times and dates, as we see then on a live system (ie, "02/12/2009 06:57 PM") or in log files can be easily translated to 32-bit Unix epoch format, and at that point, searching for a specific time or within a specific time window is a simple matter of greater than or less than.
Also, you'll notice that in the 4 events listed above, only two have User fields populated, and both are SIDs. This is one way of identifying users, and the SID can be "translated" by using RegRipper to parse the Software hive (specifically, the ProfileList key) from that system.
In the case of the Event Logs, the Description field is made of the following:
Event Source/Event ID; Event Type; Event Strings
This way, everything is easily parsed for analysis. The size of the fields can be reduced by not translating the event type field to a string identifier...this would make comparisons "easier" programmatically, but as it is now, visually it's a bit easier for an analyst to understand.
As this process/framework is being developed there was be trade-offs along the way...
Saturday, February 28, 2009
Looking for "Bad Stuff", pt II
After part I of what looks like it may become a series of Looking for "Bad Stuff" posts, I thought it would be a good idea to address this topic a bit more; clearly, one of the biggest issues most analysts may have, regardless of affiliation (LE, corporate consultant, etc.), will be simply where to begin analysis in the absence of specific guidance or criteria. Sometimes even repeated and detailed interviews of IT staff do not provide you with the information you need (or worse, may send you off in the wrong direction) and hence, you need to start by casting a wide net through malware scans (AV, anti-spyware, rootkit detectors, etc.).
So, in an attempt to develop a codified process as a response to this question, we need to start by addressing a couple of things. First, at some point before you actually start performing analysis, even before you begin the engagement, you need to ask yourself, What do I hope to achieve? Many times, this may be defined, to some degree, for you by a customer...other times, it may not. Once you start to understand your own goals, you then need to ask, What data do I need to achieve it? Whether you're beginning an engagement and scoping your acquisition, or you're sitting down to begin analysis of a single acquired image, DOCUMENTING these questions and their answers is paramount! I know, I know..."you s*ck because you make me write stuff down!" Believe me, I've heard it all before...but the fact of the matter is, if you don't write it down, it didn't happen!
Casting Your Net
Once you're ready to kick off your analysis, there are a number of ways to get started. In my previous post, I mentioned mounting the acquired image as a read-only file system and scanning it with AV software. Chris added booting the acquired image with LiveView and scanning with live rootkit detection tools such as GMER. All of this is a great way to really cast a net, but the whole idea behind a net is that it's designed and created based on a current understanding of what you're trying to catch. Early fishermen created nets based on the size of the fish they were trying to catch, and anyone who watches Man vs Wild or Survivorman has seen Bear and Les try to catch pretty small stuff (really, just about anything). As we've seen with many of the malware outbreaks lately (really, over the years), some malware isn't detected by AV products until someone else finds it and submits a sample...so if multiple malware scans come up empty, don't think that this definitely means that there is NO malware on the system.
So, there's malware (AV, anti-spyware, etc.) scans, and there's also other ways to scan for unusual or suspicious files. In the previous post, I mentioned a couple of tools...missidentify, by Jesse Kornblum, and sigcheck, from MS/SysInternals. Both of these tools can be used to attempt to identify suspicious files on a system, particularly where executable files tend to reside (system32 dir, in a Program Files subdirectory, etc.). These tools are by no means definitive...they still require someone looking at the results to determine what's legit and what's not. The reason for this is that malware authors and intruders put a lot of time and effort into remaining persistent on systems, and a tool written six months ago to detect a specific set of techniques will no longer be sufficient. Besides, to be completely honest, in a great many engagements I've been on, the easiest thing to do has been to hide in plain sight.
Another tool I mentioned was WFPCheck...you'll notice that this tool doesn't have a link. This is something I wrote a while ago to help detect the presence of malware that subverts or disables Windows File Protection (WFP), and subsequently modifies "protected" files. Now, WFP is clearly not meant as a security or protection mechanism, and there are ways (albeit a finite number of them) to subvert or disable WFP (for example, see here and here); however, detecting the artifacts of an infection is sometimes the only way we have available of determining if there was an infection.
Speaking of artifacts, another means of getting started in our analysis that we can do in parallel with the malware scans is to extract important files (Registry hive files, EVT files) from the image before mounting it, and then do some targeted analysis of those files. Tools like RegRipper and the Evt2Xls tools are extremely valuable for this kind of work, in that they are fast, efficient, and depending on the user (or perhaps more accurately, the user community), can be very, very targeted. I've written a number of plugins over the past several months that look specifically for artifacts left by specific families of malware.
What NOT To Do
One of the most often used means of "analysis" that I've seen with customers (and in user forums...forii...whateva!!) is, "I found a file and searched for the file name on Google...". Folks, this is NOT an analysis technique. Sure, it's a way to start, but it should not be all you do. There are plenty of sources out there that provide a basic understanding of things like the PE header format, both on the web and in books (hint, hint). So all I'm sayin' here is, don't let a Google search for the file name or a string you found in the file be the end of your analysis.
Monday, February 23, 2009
Printers Information
Has there been a time when you've needed to get information about what printers were on a system when analyzing an image acquired from that system?
Over on Forensic Focus, Thomas Rude pointed forum readers to an excellent resource for information about printers on Windows systems, including a number of Registry settings. A quick bit of research revealed that these values are volatile, and therefore only available when the system is live. No problem...some quick coding using the Win32_Printer class (via VBScript or Perl) gives you access to this information. A quick script returns the following:
PDFCreator [PDFCreator:]
Microsoft XPS Document Writer [XPSPort:]
Microsoft Office Document Image Writer [Microsoft Document Imaging Writer Port:]
hp deskjet 5550 series [USB001]
From the available resources, there are a number of queries and translations that can be quickly added to this script.
Now, what about collecting information about printers from an acquired image? Well, that's where RegRipper comes in, using a plugin that I quickly wrote up. Using information from the UnDocPrint site as well as from TechNet, I put together a quick plugin that extracts printer information from user hive files:
C:\Perl\forensics\rr>rip -p printers -r d:\cases\local\ntuser.dat
Launching printers v.20090223
Software\Microsoft\Windows NT\CurrentVersion\PrinterPorts
LastWrite Time: Thu Dec 18 12:39:15 2008
PDFCreator (winspool,Ne00:,15,45)
Microsoft XPS Document Writer (winspool,Ne01:,15,45)
Microsoft Office Document Image Writer (winspool,Ne02:,15,45)
hp deskjet 5550 series (winspool,Ne03:,15,45)
Default Printer (via CurrentVersion\Windows): hp deskjet 5550 series,winspool,Ne03:
Default Printer (via Printers->DeviceOld): hp deskjet 5550 series,winspool,Ne03:
The plugin extracts information about available printers that the user "sees", and also checks in two locations where MS says that the default printer is maintained. According to MS, the "NExx" included in the information about the printer indicates that it uses a network port, where "LPT1" would refer to a local port. Interestingly, running the shares.pl plugin against the System hive file from the same system shows us the following:
C:\Perl\forensics\rr>rip -p shares -r d:\cases\local\system
Launching shares v.20090112
print$
Path=C:\WINDOWS\system32\spool\drivers
Remark=Printer Drivers
Type=0
SharedDocs
Path=C:\DOCUMENTS AND SETTINGS\ALL USERS\DOCUMENTS
Remark=
Type=0
Printer2
Path=hp deskjet 5550 series,LocalsplOnly
Remark=hp deskjet 5550 series
Type=1
The Win32_Share class provides us with some information about different share types; for example, type 0 is a disk drive and type 1 is a print queue.
Have you ever needed information like this during an investigation?
Resources:
Changing a User's Default Printer in the Registry
Registry Entries for Printing
How to Add a Default Printer for All New Users
How to Manually Delete Print Shares or Printers
Saturday, February 21, 2009
Looking for "Bad Stuff", part I
Searching for unknown issues within a Windows image is always a tough thing...a great deal of the incident response and forensic analysis that I do is preceded by a triage worksheet, interviews of key personnel, etc. Sometimes, I will even ThunderDome two people who give me disparate information, simply because it's a good interro...I mean, interview technique. Anyway, the purpose of all this is to narrow down the issue as much as possible to help me identify what an issue, what the source might be, etc.
Even in the face of all this, we all sometimes still get the directive to find "all the bad stuff" on a system, either on a live system or within an image. This is like looking for something in a hay stack, only you don't know what the something is. Generally, you try to do things like ask, "when did you first notice this activity?", or "what kinds of things alerted you to this issue?"; it may be network traffic, sluggishness on the system, etc.
Recently, a friend asked how to determine if a system might be compromised. We see this a lot with incident response, as well...here's a system that we think might be compromised...can you tell us if it is? So, let's assume that you have nothing but an acquired image of a Windows system to analyze...what can you do to determine what happened on the system, with very little to go on?
Mounting The Image
One of the first things we can do to make our analysis somewhat more efficient is to gather some tools. As such, we'd like to mount our image as a read-only file system...to do so, we can look to commercial apps such as ASRData's SmartMount, or you can use freeware tools such as ImDisk or VDKWin. The VDK executable will let you get the partition table information from within the acquired image, as will the GUI-based Partition Find and Mount (discussed at the SANS Forensic Blog)...however, Partition Find and Mount does not appear to have the ability to mount a partition read-only; it will reportedly allow you to mount a potentially corrupted partition, so this may be an option...in order to recover data for analysis, mount the partition, and then acquire an image of it.
Also, as long as we're discussing mounting images, we HAVE to talk about F-Response Enterprise Edition and the Management Console that Matt has released! When working in a live scenario when an enterprise capability is required, the FEMC makes it SO easy to connect to a live system and collect data, and F-Response, by its very nature, makes it SO safe.
Let's not forget all of the great work Rob Lee has done with SIFT! "SIFT" is the SANS Investigative Forensic Toolkit Workstation, a Linux-based VM that Rob has assembled for use, not only in training, but also in practical application. Rob even recently posted to the SANS Forensic blog, demonstrating how you can use SIFT and the Linux "mount" capability to mount your acquired image as a read-only file system in Linux, and then access it via Windows.
Getting yer Scan On!
Okay, choose whichever means or method works for you...but at this point, we can assume that we have an acquired image mounted on our analysis system as a read-only file system/drive letter. A great way to get started on "looking for bad stuff" is to start with some AV/anti-spyware scans. Now, running these scans does not mean we're lazy...it means we're smart; we're making use of our available resources to perform a modicum of data reduction.
To that end, here are some links to free AV scanners:
Free AV Scanners
Portable AV/Malware Security Tools
PCTools - Free AV
MalwareBytes
One of the reasons why I mention these free AV tools isn't just because they're free...part of it has to do with their limited capability. What I mean by this is that most of the free AV tools are just scanners...in order to get real-time protection, you need to pay for the additional capability. Yeah, but...we don't want the real-time protection...all we want is to be able to update the tool (even manually...including the fact that we did so in our documentation), and run a scan when we decide to...even if it means as a Scheduled Task. One of the great things about these tools, particularly the ones that are portable, is that you can keep them all on a thumb drive, update them regularly, and run them right from the thumb drive. I've has some great success with many of these, including ClamAV and a2Free.
Targeted Analysis
Okay, getting some of our bulk data reduction out of the way is a great way to get started, but nothing is going to keep us from the need to roll up our sleeves and get deep into the weeds with our analysis. Also, in the face of a lot of recent activity, one of the things that is obvious is that the AV industry, by it's nature, is usually one step behind the malware authors. Therefore, don't be surprised if you've scanned the mounted image and not found anything specific that would point to the activity in question. This is where a more surgical approach is required...besides, this is more fun, too!
Log files
If you're read (or heard from someone who has read) my book, you'll know that Windows systems are just chock full of log files! There are a number of places you can look for information about that status or state of the system, determining such things as attached devices and installed software. One useful log file is MRT.LOG, which is used by the MS Malicious Software Removal Tool. This is essentially a microscanner (similar to McAfee Stinger) in that it protects a system against a very limited set of threats. This can help you narrow down what might have been on the system.
Don't forget that AV applications keep their own logs, as well. Mandiant's recent release of the APT Forensics M-unition Pack includes a PowerPoint presentation that lists, for example, the location of Symantec AV OnAccessScan logs. AV products generally tend to keep logs as to when the product was last updated, as well as the status of various scans that have been run, either automatically or on demand.
Event Logs
The Windows Event Log is something of a specialized log, as on Windows XP and 2003, they are kept in a binary format (Vista and beyond use an XML format). While the actual configuration of what is and isn't audited is controlled, in part, through the Registry, some applications will record information in the Event Logs. For example, AV applications will record information in the Event Log.
Parsing the Event Log into something readable can be difficult, unless you have the right tools. I tend to start with my own; evtrpt and evt2xls.
Note: Evt2Xls does NOT have a 64K limit on the number of rows it will process...that limit is imposed by some versions of Excel. The spreadsheet app in OpenOffice apparently does not have that same limit.
Registry Analysis
This can be a pretty comprehensive subject, one which I've already started down the road on...I won't go into any more detail here, but will instead leave this for later discussions.
Specialized Tools
There are also a number of specialized tools you can use to help narrow down any issues that might come up...I'll list them here without a great deal of explanation in hopes of generating questions or discussion:
missidentify
sigcheck
WFPCheck - not a released tool, but something I wrote (and discussed in WFA 2/e) that I use to help me determine if there's been something on the system that disabled WFP and infected or replaced "protected" files
LADS
Yara and Scout Sniper - you should really check this out!
Practical Application
The more data you have, the better you will be able to narrow things down. I recently performed an examination of an image, and had some external network-based sources that I was able to use to determine the source of certain behaviour that had been observed on the network. Service start times within the Event Log correlated very closely to the times that network-based applicance logs showed certain activity starting on several days; from this, I was able to narrow down the presumed malicious activity to the interaction between two applications on the system.
Note: I don't care what Webroot customer support tells you...even if Spy Sweeper is not configured to protect the hosts file, it will still parse it and issue DNS queries for the domains found in that file.
Friday, February 20, 2009
TimeLine Analysis part II (Sources)
I posted earlier on TimeLine Analysis, and wanted to add some thoughts that went into the entire process with respect to sources of timeline data. Most of us think of a host system and think of an acquired image, and then think of something like TSK tools (fls) or EnCase when we think of timeline data being extracted from the file system. Historically, file MAC times have been extremely important with respect to forensic analysis, but over time, we've been adding other sources of timeline data.
For example, Lance recently posted on using MFT entries to detect the use of utilities to alter timestamps.
Of course, there's the Registry, and a number of ways for extracting timeline data from hive files, including key LastWrite times (including from deleted keys), and timestamps embedded in Registry values (UserAssist keys, MRUs, etc.). RegRipper gets a lot of this data now, so it's readily available.
Event Logs are a great source of timeline information, as the event records are in the right format to define an event.
Over the past 2 yrs or so, I've been associated with a number of examinations involving SQL injection, many of which relied on the IIS web server logs as the initial source of information.
Memory dumps have timestamped data that can be extremely useful in timeline analysis.
What about sources outside of a host system? Network packet captures, firewall or device logs, etc., all include timestamped information.
Of course, when collecting and normalized timestamped data, an analyst has to address issues such as timezones (I recently worked with some data where some of the logs were presented in EST format and others in GMT), as well as clock skew. Also, there may be events that do not lend themselves to easy extraction via some automated means, such as using a Perl script; for these events, having a dialog box where the analyst can enter all of the necessary information would likely be the best approach.
I also wanted to point out HogFly's blog post with respect to data representation. Very cool. I think it tells the story about what happened, getting dry, technical information across while at the same time engaging the non-technical reader.
Thursday, February 19, 2009
Application Forensic Artifacts
Forensic artifacts left by installed applications can be an excellent source of data when performing analysis. For example, MRU lists used by applications (and maintained in the Registry) can lead to demonstrating that not only did the suspect know that the files were on the system, but that they viewed them. I've spoken with LEOs who've used this technique successfully.
Here's an excellent post regarding what has been found with respect to Corel Photoshop.
AV application log files can provide a great deal of insight into activity that occurred on the system, such as updates, when scans were run and the results, etc.
Here's an excellent post regarding what has been found with respect to Corel Photoshop.
AV application log files can provide a great deal of insight into activity that occurred on the system, such as updates, when scans were run and the results, etc.
Tuesday, February 17, 2009
Virut: Unanswered Questions
One of the things that really bothers me sometimes about the AV industry is the lack of information that's available with respect to a great deal of the malware that's out there.
Take Virut, for example. Microsoft's Malware Protection Center had a post here about a new variant being available, and there's information here regarding the Virut virus family (info about the latest variant, Virut.BM, is here).
Of course, the various AV vendors also provide some modicum of information about either the Virut family or a specific variant, all with varying levels of information. Some, like McAfee, provide more information than others, so that if the AV product itself isn't picking up the virus (due, in part, to its polymorphic nature) then maybe you can look for artifacts (modification to the hosts file, Registry keys/values, etc.) that may help you narrow down not only the infection, but also help you identify other infected systems.
One interesting aspect of all of this, and glaringly obvious in its absence, is any discussion of Windows File Protection, or WFP. While WFP is not mean to be a security mechanism, per se, the fact of the matter is that if Virut infects all EXEs on a system, then it would stand to reason that protected system files that are infected would be replaced by WFP...IF it were not disabled. Since there seem to be no discussions about this at all (at least not since Dec 2007), then it would stand to reason that the virus does, somehow, disable WFP.
So...does anyone have any thoughts on why Microsoft isn't letting its customers know about this?
Addendum: First, per the comments to this post, the MMPC listing for the virus was updated to include information on the method used to disable WFP/SFP while this post was being written.
Now, in yet another example of the massive disconnect between AV vendors and their customers, McAfee has a post on W32/Virut.n that refers to "Registry entries", without specifying whether the entries are Registry keys or values. Symantec, on the other hand, calls the data added to the Registry an "entry" in their W32.Virut.CF post, but provides enough information to indicate that it's a value.
How is this a disconnect? Many customers of these AV vendors have enterprise-wide infrastructures, and need to determine other systems that may be infected. MS's WMI provides a fantastic capability to quickly determine this...and yet, without clear, concise, and correct information, customers are left struggling.
Is it really that hard? I mean, you've done the analysis, and have the information. What's the issue? Also, why is MS the only vendor that I've found so far to make any mention of WFP being disabled?
HBGary: FastDump and Responder
Thanks to Rich Cummings, I was recently able to take a look at HBGary products that they offer with respect to physical memory collection and analysis; specifically, FastDump Pro and Responder Professional.
First, the FastDump product is pretty cool. The free version of the tool allows you to dump the contents of physical memory from pre-Windows 2003 SP 1 systems (XP, Windows 2003 w/ no Service Pack). Now, a lot of folks are going to look at FastDump Pro and wonder why it's available for a fee; well a close look at the write up for the FastDump Pro should very quickly make anyone realize that the tool is definitely worth what they're charging; FDPro is not encumbered by the 4GB limit, works up to Windows 2008 (Windows 7 Ultimate Beta shouldn't be a problem, either), and it handles both 32- and 64-bit versions of Windows. That's A LOT packed into a $100 executable! FDPro also has the capability to incorporate collection from the pagefile, as well; however, in the limited testing I've done so far, analysis tools other than Responder won't necessarily "understand" the .hpak format.
Before we look at the Responder product, I'll have to upfront about my testing...my focus was incident response, and I really didn't intend to fully exploit Responder's malware analysis capabilities. So, essentially, while I had access to an evaluation version of the Responder Pro product, I was really using what amounted to the capabilities in the Field Edition. However, one of the things I've really been pushing with respect to incident response is speed...when an incident occurs, information collection and analysis needs to start as soon as possible, and tools like FastDump Pro and F-Response give you that speed in collection; Responder gives you speed in analysis for a range of Windows operating systems through a common interface.
So I started off by creating a ca se in Responder and loading the first memory dump/snapshot from the DFRWS 2005 Memory Challenge. Now, the snapshot can be a raw memory dump, collected via dd.exe (no longer available), F-Response + {enter a tool here}, FastDump, FastDump Pro, etc. Responder will identify the operating system of the memory dump and extract a good deal of information, making it available to the responder via the user interface (UI). So, once the memory dump has been collected, it just takes a couple of mouse clicks to get to the point where the responder is actually looking at the contents of the memory dump, viewing things such as the active process list, network connections, etc.
When I first looked at the Responder product a bit ago, as an incident responder, one of the issues I had as being able to quickly and easily find what I was looking for...in particular, the command line used to launch each of the p rocesses in the active process list. Well, not only is this now available in the current version of the product, but you can also drag the columns in the UI to a more suitable location. For example, I dragged the column for the process command line over to line up the process name, PID, parent PID, and command line so that I could see everything together and quickly run through the entries.
 You can also view the open network sockets from the memory dump in a very netstat-like format. An option that the Responder product provides is the ability to export the data you're viewing in a variety of formats (Note: the export functionality was disabled in the evaluation version). This allows you to use either screen scrapes of the Responder UI or exports of the data for reporting, or you export the data you've got and use tools similar to Gleeda's vol2html.pl to modify the format a bit.
Now, one of the options when importing a snapshot is to "Extract and Analyze All Suspicious Binaries"; this allows for a modicum of analysis to occur while importing the snapshot. What is "suspicious" is defined by rules visible in a text file, which means that as you become more familiar with the tool, you can comment out some of the rules, uncomment some, or add your own.
With Responder, you can also view the open handles and network sockets for a specific process, view, analyze, or save a copy of a binary (exe or DLL/module), run strings against a binary, etc. There is a great deal of capability in this tool, and there's no way I'm even beginning to scratch the surface. From an IR perspective, tools like this provide the first responder with a means of getting answers quickly, while at the same time being able to "answer new questions later". This is an extremely powerful capability...imagine quickly triaging an incident and being able to narrow down from your 500 possible systems the 12 or so that may be "in scope". Consider the cost savings. And when you do acquire physical memory, you've also got a copy of the malware (if there is any) in an unencrypted, un-obfuscated state.
Admittedly, Responder doesn't give you the same granularity, deep-dive capabilities, and flexibility of Volatility, but it does allow you to import memory snapshots from a range of Windows versions and puts the tools in your hands to quickly get the answers you need; that in itself is a huge plus! Again, I did not really dig into the full spectrum of capabilities of FastDump Pro and Responder, so if you're interested in really exploiting HBGary's capabilities for doing malware analysis, you should definitely consider giving them a call.
First, the FastDump product is pretty cool. The free version of the tool allows you to dump the contents of physical memory from pre-Windows 2003 SP 1 systems (XP, Windows 2003 w/ no Service Pack). Now, a lot of folks are going to look at FastDump Pro and wonder why it's available for a fee; well a close look at the write up for the FastDump Pro should very quickly make anyone realize that the tool is definitely worth what they're charging; FDPro is not encumbered by the 4GB limit, works up to Windows 2008 (Windows 7 Ultimate Beta shouldn't be a problem, either), and it handles both 32- and 64-bit versions of Windows. That's A LOT packed into a $100 executable! FDPro also has the capability to incorporate collection from the pagefile, as well; however, in the limited testing I've done so far, analysis tools other than Responder won't necessarily "understand" the .hpak format.
Before we look at the Responder product, I'll have to upfront about my testing...my focus was incident response, and I really didn't intend to fully exploit Responder's malware analysis capabilities. So, essentially, while I had access to an evaluation version of the Responder Pro product, I was really using what amounted to the capabilities in the Field Edition. However, one of the things I've really been pushing with respect to incident response is speed...when an incident occurs, information collection and analysis needs to start as soon as possible, and tools like FastDump Pro and F-Response give you that speed in collection; Responder gives you speed in analysis for a range of Windows operating systems through a common interface.
So I started off by creating a ca
 se in Responder and loading the first memory dump/snapshot from the DFRWS 2005 Memory Challenge. Now, the snapshot can be a raw memory dump, collected via dd.exe (no longer available), F-Response + {enter a tool here}, FastDump, FastDump Pro, etc. Responder will identify the operating system of the memory dump and extract a good deal of information, making it available to the responder via the user interface (UI). So, once the memory dump has been collected, it just takes a couple of mouse clicks to get to the point where the responder is actually looking at the contents of the memory dump, viewing things such as the active process list, network connections, etc.
When I first looked at the Responder product a bit ago, as an incident responder, one of the issues I had as being able to quickly and easily find what I was looking for...in particular, the command line used to launch each of the p
 rocesses in the active process list. Well, not only is this now available in the current version of the product, but you can also drag the columns in the UI to a more suitable location. For example, I dragged the column for the process command line over to line up the process name, PID, parent PID, and command line so that I could see everything together and quickly run through the entries.
 You can also view the open network sockets from the memory dump in a very netstat-like format. An option that the Responder product provides is the ability to export the data you're viewing in a variety of formats (Note: the export functionality was disabled in the evaluation version). This allows you to use either screen scrapes of the Responder UI or exports of the data for reporting, or you export the data you've got and use tools similar to Gleeda's vol2html.pl to modify the format a bit.
Now, one of the options when importing a snapshot is to "Extract and Analyze All Suspicious Binaries"; this allows for a modicum of analysis to occur while importing the snapshot. What is "suspicious" is defined by rules visible in a text file, which means that as you become more familiar with the tool, you can comment out some of the rules, uncomment some, or add your own.
With Responder, you can also view the open handles and network sockets for a specific process, view, analyze, or save a copy of a binary (exe or DLL/module), run strings against a binary, etc. There is a great deal of capability in this tool, and there's no way I'm even beginning to scratch the surface. From an IR perspective, tools like this provide the first responder with a means of getting answers quickly, while at the same time being able to "answer new questions later". This is an extremely powerful capability...imagine quickly triaging an incident and being able to narrow down from your 500 possible systems the 12 or so that may be "in scope". Consider the cost savings. And when you do acquire physical memory, you've also got a copy of the malware (if there is any) in an unencrypted, un-obfuscated state.
Admittedly, Responder doesn't give you the same granularity, deep-dive capabilities, and flexibility of Volatility, but it does allow you to import memory snapshots from a range of Windows versions and puts the tools in your hands to quickly get the answers you need; that in itself is a huge plus! Again, I did not really dig into the full spectrum of capabilities of FastDump Pro and Responder, so if you're interested in really exploiting HBGary's capabilities for doing malware analysis, you should definitely consider giving them a call.
Thursday, February 12, 2009
One World, Under F-Response
Matt Shannon is one of those guys that comes along and has a noticeable and definite impact on the world of Incident Response. First there was Nigilant32, then there was F-Response, with which Matt and his crew were able to provide a whole new...and much needed...capability to incident responders.
In October 2008, at the SANS Forensic Summit, Matt and Aaron Walters gave an excellent presentation on Voltage (F-Response + Volatility), showing how a responder can deploy F-Response and use functionality based on Volatility to fight malware. The presentation and the implementation were awesome!
More recently, Matt's shown how F-Response can be used with Nuix and Intella (be sure to check out the videos), clearly showing how F-Response's tool-agnostic framework can be used to really leverage the capabilities of other tools. Matt and Jamie Butler of Mandiant also recently announced that Memoryze supports F-Response.
Well, Matt's gone and done it again with the F-Response Enterprise Management Console (blip.tv video...even if you don't have F-Response EE yet, you should still watch this video)! Until now, pushing out F-Response EE to one system required some work in the command prompt, but now, Matt's made it so that it takes more effort for me to play BrickBreaker on my BlackBerry than it does for me to push out F-Response EE to one, two, or a dozen systems on a network!
So that's what I did...I fired up my Window 7 Ultimate Beta VM and basically followed Matt's video. As a caveat to this, I do have some experience working with F-Response EE via the command prompt, so it may have gone a bit more smoothly for me than for a first time user...but Matt's video is the best place to start. In the video, Matt walks through the various components of the UI and how you use each piece of information.
You can scan a workgroup or domain, IP address range, or directly connect to a system. I chose to connect directly to t he system itself, in order to try out that functionality. Once I got connected to the VM (this is the VM I downloaded from BitTorrent, so it appears with the TuxDistro-PC system name), I could clearly see the system in the UI.
From there, all I needed to do is walk through the FEMC interface to install F-Response on the remote system and start the service with the name I provided through the UI. Since I wanted to se e the physical memory (and had selected that through the UI) on the remote system, once F-Response was up and running and I had connected to the remote system, I could see two targets. The first target listed (:1) is the physical memory from the remote system, and the second target listed (:0) is the hard drive. At this point, notice that I haven't had to open the iSCSI Initiator console at all...all of the functionality for managing the use of F-Response EE is handled through a single interface.
Pretty cool so far...at this point, this has all just been a couple of mouse clicks. So the next step is to fire up the Disk Manager on the syste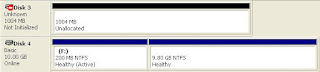 m from which I'm running all this...the memory from the remote system appears as Disk3, and the hard drive appears as Disk4. As the memory does not consist of a recognized file system, it's going to be accessible as \\.\PhysicalDisk3, and can be accessed via FTK Imager or Memoryze, which just reinforces how F-Response is a tool-agnostic platform. The larger partition from Disk4 got mapped to my analysis system as the I:\ drive, and from there I was able to run tools of my own, like RegRipper, which allows me to perform a modicum of triage and analysis.
These will show up in the FEMC UI, you don't NEED to go to the Disk Manager to see and access them...I simply show them here for the sake of transitioning from the CLI method. The physical disks themselves are shown in the Connect tab (you may need to refresh the UI to see them, but they'll be there). Also, you can follow what's happening in the Messages tab, and even cut-n-paste all of the messages from your session and use those in your case notes as your documentation.
Matt blogged on the FEMC here.
I've got two words for you. Suh. WEET! There's no question...for what amounts to a very modest price, you (consultant, IT staffer, etc.) have the capability to get answers NOW, whether you're responding to an incident, or addressing an HR issue, or even just network or system troubleshooting. For example, the current model of incident response is when something happens, many organizations call someone; from there, it takes time set up a conference bridge, describe to someone who isn't familiar with your infrastructure what's going on, and then they have to grab their gear and get on a plane...it could be 24 (or more) hours before someone's on-site, and then they have collect data. With F-Response and the FEMC, you can now preserve the data (i.e., in the case of new malware, collect a memory dump), provide it to consultants, and start getting answers while whomever is designated to come on-site is still looking for flights!
In October 2008, at the SANS Forensic Summit, Matt and Aaron Walters gave an excellent presentation on Voltage (F-Response + Volatility), showing how a responder can deploy F-Response and use functionality based on Volatility to fight malware. The presentation and the implementation were awesome!
More recently, Matt's shown how F-Response can be used with Nuix and Intella (be sure to check out the videos), clearly showing how F-Response's tool-agnostic framework can be used to really leverage the capabilities of other tools. Matt and Jamie Butler of Mandiant also recently announced that Memoryze supports F-Response.
Well, Matt's gone and done it again with the F-Response Enterprise Management Console (blip.tv video...even if you don't have F-Response EE yet, you should still watch this video)! Until now, pushing out F-Response EE to one system required some work in the command prompt, but now, Matt's made it so that it takes more effort for me to play BrickBreaker on my BlackBerry than it does for me to push out F-Response EE to one, two, or a dozen systems on a network!
So that's what I did...I fired up my Window 7 Ultimate Beta VM and basically followed Matt's video. As a caveat to this, I do have some experience working with F-Response EE via the command prompt, so it may have gone a bit more smoothly for me than for a first time user...but Matt's video is the best place to start. In the video, Matt walks through the various components of the UI and how you use each piece of information.
You can scan a workgroup or domain, IP address range, or directly connect to a system. I chose to connect directly to t
 he system itself, in order to try out that functionality. Once I got connected to the VM (this is the VM I downloaded from BitTorrent, so it appears with the TuxDistro-PC system name), I could clearly see the system in the UI.
From there, all I needed to do is walk through the FEMC interface to install F-Response on the remote system and start the service with the name I provided through the UI. Since I wanted to se
 e the physical memory (and had selected that through the UI) on the remote system, once F-Response was up and running and I had connected to the remote system, I could see two targets. The first target listed (:1) is the physical memory from the remote system, and the second target listed (:0) is the hard drive. At this point, notice that I haven't had to open the iSCSI Initiator console at all...all of the functionality for managing the use of F-Response EE is handled through a single interface.
Pretty cool so far...at this point, this has all just been a couple of mouse clicks. So the next step is to fire up the Disk Manager on the syste
 m from which I'm running all this...the memory from the remote system appears as Disk3, and the hard drive appears as Disk4. As the memory does not consist of a recognized file system, it's going to be accessible as \\.\PhysicalDisk3, and can be accessed via FTK Imager or Memoryze, which just reinforces how F-Response is a tool-agnostic platform. The larger partition from Disk4 got mapped to my analysis system as the I:\ drive, and from there I was able to run tools of my own, like RegRipper, which allows me to perform a modicum of triage and analysis.
These will show up in the FEMC UI, you don't NEED to go to the Disk Manager to see and access them...I simply show them here for the sake of transitioning from the CLI method. The physical disks themselves are shown in the Connect tab (you may need to refresh the UI to see them, but they'll be there). Also, you can follow what's happening in the Messages tab, and even cut-n-paste all of the messages from your session and use those in your case notes as your documentation.
Matt blogged on the FEMC here.
I've got two words for you. Suh. WEET! There's no question...for what amounts to a very modest price, you (consultant, IT staffer, etc.) have the capability to get answers NOW, whether you're responding to an incident, or addressing an HR issue, or even just network or system troubleshooting. For example, the current model of incident response is when something happens, many organizations call someone; from there, it takes time set up a conference bridge, describe to someone who isn't familiar with your infrastructure what's going on, and then they have to grab their gear and get on a plane...it could be 24 (or more) hours before someone's on-site, and then they have collect data. With F-Response and the FEMC, you can now preserve the data (i.e., in the case of new malware, collect a memory dump), provide it to consultants, and start getting answers while whomever is designated to come on-site is still looking for flights!
Tuesday, February 10, 2009
Using RegRipper for malware detection
Sometimes during post-mortem analysis (or during incident response using F-Response) the question you may be faced with or that may be peripheral to your analysis is, was the system infected with some kind of malware? This can particularly useful as some AV products may not detect the malware files themselves, and some malware disables AV products when installed. Also, there have been a number of examples recently where the malware files themselves have random names, so understanding the persistence mechanism (i.e., Registry artifacts) might help narrow things down tremendously, and quickly.
Well, you can use RegRipper to help you figure this all out.
Take for example Trojan.Brisv.A...according to the Symantec write up, when a system is infected, it creates the Software\Microsoft\PIMSRV key in the user's hive. Since this is a unique key, it can be indicative of an infection. This malware also modifies two Registry values within the user's hive specific to Windows Media Player:
Software\Microsoft\MediaPlayer\Preferences\URLAndExitCommandsEnabled; changes the data to "0"
Software\Microsoft\MediaPlayer\Player\Extensions\.mp3\Permissions; changes the data to "21"
So, all someone needs to do is write a plugin for RegRipper that checks for the existence of the first key, as well as the data within the two values.
As it is, the mpmru.pl plugin will retrieve the list of files most recently played via Windows Media Player...what you want to look for (based on the Symantec write up) is a .wma file that was played.
Addendum: To add to this, the MS Malware Protection Center recently posted on a spam-for-hire Trojan with rootkit functionality called Win32/Srizbi. This malware reportedly uses the Run key as its persistence mechanism (which RegRipper already extracts values from), and installs its kernel-mode rootkit in the Services key, which RegRipper also extracts. Further examples, such as Win32/Roron, illustrate other examples of where RegRipper can be used to check the Registry for indications of an infection.
Friday, February 06, 2009
Tools
A couple of tools I've written have popped up on other blogs recently, so I thought I'd link to those blogs here...
Andrew Hoog posted a HOWTO on his eDiscovery blog, which illustrates how to extract metadata from Word doc files, on Linux systems. I really like Andrew's post for a number of reasons, not the least of which is that it highlights both something I wrote and Perl in the same post! But seriously...the format is great, and it's very comprehensive and easy to follow, particularly with respect to how to install the necessary Perl modules to get the wmd.pl script working properly. This script is included on the DVD that accompanies both the first and (soon-to-be-published) second editions of Windows Forensic Analysis. One of the interesting additions to the second edition of WFA is a case study of a time I used wmd.pl's sister script, oledmp.pl, to further my analysis.
RegRipper made it into the SANS Forensic blog in a post by Keven Murphy. Keven's post illustrates how to run RegRipper (the GUI) under WINE, or you can use Daniele's modified version of rip.pl to run that under Perl on Linux.
Just a couple of things that I'd like to mention in order to clarify Keven's post a bit...
First, he's right...RegRipper does use "pre-canned" plugins...just like Nessus. And just like Nessus, the plugins are essentially text-based, so anyone can (and has) open them, read them, modify them, or write their own plugins. In fact, Jason's even created a plugin generator!
Second, to update the plugins, just drop them into the plugins directory...it's that easy!
Thanks for the shout-out, Keven! Glad you like RegRipper, and I'd love to hear your thoughts for modification or improvement. Also, once the book's complete and into publication, I'll focusing my efforts on RegRipper v3!
Over on the RegRipper forums, a RegRipper user posted about how he'd used FTK Imager to extract all of the Administrator user hive files from the XP Restore Points into a directory called "restpts", and then used the following batch script to run a single plugin across all of the extracted hive files:
for /R restpts %i in (*) do rip -p typedurls -r "%i" >>typedurls.txt
This is a great way to do this kind of thing with what you have, but ripXP was designed to do this, and pulls out a bit more information, as well, in order to provide additional context to the information. I know what you're going to say, and you're right...ripXP is not publicly available as of yet...but that's a discussion for another time.
Wednesday, February 04, 2009
More on Data Breaches
Beware...here's your warning: This post is NOT specifically about Windows incident response or forensic analysis. Okay. There. You've been warned.
Brian Krebs of the SecurityFix blog posted recently that data breaches are more costly than ever. I can't say as I'm surprised...security folks have known for a long time that the cost of cleaning up a mess is much, much more than the cost of finding and fixing the issues before an incident happens (ie, how much does it really cost to put a password on that 'sa' account?). In some ways, this is common sense, but apparently, not "common" enough.
Look at the first sentence of Brian's post: Organizations that experienced a data breach paid an average of $6.6 million last year to rebuild their brand image and retain customers following public disclosures of the incidents...
I think that this makes a couple of key points...
I found a similar article on DarkReading, as well. Both articles reference the Ponemon Institute study, the US Cost of Data Breach Study. A couple excerpts from the articles that I found interesting:
Data breaches experienced by "first timers" are more expensive than those experienced by organizations that have had previous data breaches....
No kidding. You get caught with your pants down (I wish I had a graphic, but hey, this is a PG-13 blog), and that's what happens. You don't know enough about your architecture or infrastructure, about where sensitive data is stored or processed...and then someone intrudes into your network and figures it out...but not for you. For themselves. And takes stuff.
Also, Brian pointed out hard costs associated with breaches, such as hiring forensic analyst and responder firms, setting up call centers, and discounts on future products. These all go beyond the other hard costs, such as notification (estimated now at ~ $100 per record), law suits (don't believe me? Check out this article...), etc.
The fact of the matter is that breaches themselves are far less expensive than the cost of preparation. There's no question...incidents WILL happen. We've seen the surveys, and we've seen this in the media. So why wait for a breach to happen in order to justify spending to prevent or detect security incidents? I mean, seriously...do companies hire employees and wait until someone brings a law suit to start paying them? Do companies offer a product without sales, marketing, maintenance, and some way of billing customers (invoice, collections, etc.)?
So where most organizations are right now is that they're likely sitting at a table with someone who wants to sell them services of some kind that have to do with security. The decision point is the certainty of the purchase order that the sales guy is pushing across the table versus the possibility of a major data breach occurring at some point in the future. I understand this. However, what I do not understand is why organizations that store and process MY sensitive data do not recognize that that possibility or probability is rapidly approaching certainty. If you cannot clearly demonstrate your controls and you have no visibility into your infrastructure, the I would suggest that it's already there.
Despite their experiences, however, most companies still don't plan financially for data breaches.
Now, see this is the part I don't get. It's one thing to look at the Hannafords and the Heartlands, and to think, hey, it won't happen to ME. However, it's another thing entirely for it to happen to you, for you to be informed as to just how vulnerable you really are, and then for you to think, hey, it won't happen to me AGAIN.
The study also does not measure the cost of intellectual property that is lost or stolen as a result of a data breach.
Ugh. How many organizations out there are smuggly grinning ear-to-ear, because they don't store or process "sensitive data", as defined by PCI, NCUA, or any of the abundant state legislation, all while their intellectual property is being siphoned off? "No, we don't have to meet compliance because we're not required to." Well, don't you want to...you know...protect your intellectual property (R&D, manufacturing process specs, new drug/medication design specs, etc.) just because its the RIGHT THING to do? Well, no...where's the ROI in that?
Oh, and since I mentioned Heartland, I simply can't let this pass without mentioning Cory's comments on this recent StoreFrontBackTalk article. To me, as an experienced responder, this is a great example of "denial isn't just a river in Egypt". Yeah, it's also a great example of how these things get wildly miscommunicated through Public Relations or Corporate Communications, and then on to the media, but it also reminds me that folks are more likely to tell their friends, "hey, I got mugged on the way home from work and beat up by the Pittsburgh Steeler's defensive line", when in fact the truth is that a 12 yr old girl took your wallet. Another way to say it is, make the story sound a lot better than it really is...don't let the facts get in the way of a good story.
Tuesday, February 03, 2009
Forensic Links
This post is just a series of links I've come across lately that I've found interesting, and I wanted to provide these along with some context...
Barry Grundy of NASA runs the LinuxLeo.org site; while his site is not specific to Windows, his beginners guide provides an excellent resource to new users, and he does have a couple of NTFS images for download and use in his practical exercises.
This "Investigating Windows Systems" article from Linux magazine is an excellent resource, as many of the commands used in the article are also available as Windows-based tools, and can be used with VDKWin or ImDisk. The article provides links to tools like pasco and mork.pl (or you can get the Perl module here, or get the module using ppm on ActiveState Perl), and you can get a Windows version of ntfsundelete here.
Jolanta Thomassen did some excellent work with respect to analyzing Registry hive files for deleted keys, and providing code to demonstrate this functionality. Her code can be found in the Downloads section of RegRipper.net, and her disseration is available here.
Don Weber of Security Ripcord posted on Windows incident response, using only system resources. To top it off, he posted his script, as well.
Naja Davis has written an excellent paper on Live Memory Acquisition for Windows, referencing among other things, the first edition of Windows Forensic Analysis.
Richard McQuown posted on actually using some of Moyix's new Volatility plugins to actually do stuff. Some very cool stuff. It's always great when someone produces something (like Matt Shannon and F-Response) and them someone else actually uses it.
Monday, February 02, 2009
TimeLine Analysis
Note to the reader, and to self: This topic is more than likely going to be spread out over several posts, as the information develops...
As I've been working on the second edition of Windows Forensic Analysis, as well as working my own engagements and assisting with others, I've been doing some serious thinking about timeline analysis. Well, to be honest, I'm not so much bringing this up myself as sort of adding to what Michael Cloppert posted on the SANS Forensics Blog. Michael wrote the ex-tip tool and a really great paper about it (basic concept, design, etc.), and I've been doing some thinking about this very same subject over the past couple of weeks/months, particularly after exchanging some emails with Michael and Brian Carrier. Apparently, others have been thinking about this subject, as well, including our friend HogFly (see his excellent Footprints in the Snow post).
A lot of my thinking along these lines started with Brian Carrier's TSK tools (also available for Windows) and the fls tool he wrote which created a body file from the file system in the image. I had thought about writing a tool or adding the capability to RegRipper to report data in a format that could be easily added or appended to a body file and then included in the parsing process used by mactime or ex-tip. Mike included this sort of capability as a plugin to ex-tip, but it simply retrieves the LastWrite times of all of the keys and doesn't provide the level of context or data reduction available through something like RegRipper (or rip.exe). Like Mike, I also started looking at other sources of data, including parsing Event Logs with evt2xls and incorporating that information directly into timeline analysis.
However, it occurs to me that a couple of modifications to the current processes for collecting and parsing the timeline data can lead to improvements in the overall process, including presentation and reporting of the collected data, taking it beyond mactime's text-based output.
For example, what defines an event in a timeline? At the least, if you're only looking at data from a single system, you need a point in time (say, normalized to the Unix epoch as a means of standardization) and a description of the event. If you move to incorporating additional sources (network traffic captures) as well as data from additional systems, you need to include source (i.e., Registry, Event Log, AV logs, etc.) and host (system NetBIOS or DNS name, IP address, MAC address, etc.) information, and possibly even user (username, email address, SID, etc.) information.
Taking this a step further, for the purposes of data reduction, you might want to define a span event, as opposed to a point in time...rather than listing a tremendous number of file access events due to an AV scan, why not simply define the AV scan as a span event, and remove the various points? Or, parsing the Event Logs, you can define a span as the time that a system was running or that a user was logged in.
So at this point, an event structure might look something like this:
Type - Point or span; can be represented as a binary (1 or 0) value
Time - MS systems use 64-bit FILETIME objects in many cases; however, for the purposes of normalization, 32-but Unix epoch times will work just fine
Source - fixed-length field for the source of the data (i.e., file system, Registry, EVT/EVTX file, AV or application log file, etc.) - (may require a key or legend)
Host - The host system, defined by IP or MAC address, NetBIOS or DNS name, etc. (may require a key or legend)
User - User, defined by user name, SID, email address, IM screenname, etc. (may require a key or legend)
Description - The description of what happened; this is where context comes in...
I think you can see how this opens things up a bit to allow for other sources of data. Not all of the fields in the structure need be present; again, a time and a description are enough to define an "event" for a timeline.
What about representation and reporting of the data? Text-based or even a spreadsheet might be nice for some data representation, but something graphical may be more appropriate when working with larger data sets. Presentation means such as Zeitline, EasyTimeline, and Simile Timeline (Jerome has some additional information on manually adding events to Simile) are available, each with their own strengths and weaknesses. However, I've found that for both analysis and presentation to an end user (i.e., customer, etc.) a graphical approach can be very useful.
Sunday, February 01, 2009
Thoughts on memory footprints...
I was chatting with a friend the other day, and we got to talking about the issue of the memory footprints of various tools. We agreed on the need to capture the contents of physical memory first during incident response activities, before doing anything else. I'm also a proponent of grabbing the portions of memory (active process list, network connections, etc.) as well, as this information can be used to do a modicum of differential analysis, as well as give you a quicker view into what's going on...but be sure to grab as pristine a copy of memory first. As Nick and Aaron said at BlackHat DC 2007, so you "...can answer new questions later." Sage advice, that.
So we got to talking about the effect that just the first tool will have on memory...whichever tool you choose to use to dump the contents of physical memory, be it F-Response, FastDump, mdd, win32dd, winen, Memoryze, or if you choose to kick it old school on XP, an old, unsupported copy of dd.exe. Regardless, when you launch the tool, the EXE is loaded into memory to be run, establishing a presence in memory and a "footprint". This is something that cannot be avoided...you cannot interact with a live system without having some effect on the system. Responders should also be aware that the converse is true...during incident response for something like a major data breach (not naming names here...Heartland), the system will continue to change even if you don't touch the keyboard at all. Such is the nature of live response.
When the EXE is loaded into memory, it consumes pages that have been marked as available; these pages are not currently in use, but may contain remnants that may be valuable later in the examination, much like artifacts found in unallocated space on the hard drive. This is somewhat intuitive, if you think about it...if Windows were to launch a new process using pages already in use by another process, then you'd have random crashes all over the place. Depending on the amount of memory in the system, the memory manager may need to write some of the pages being used by other processes out to the pagefile/swap file in order to free up space...but again, the new process will not consume pages currently being used by another process.
I know that this is an overly simplistic view of the whole process, but its meant to illustrate a point...that point being that there's a LOT of discussion about "memory footprints" of various tools, but when I listen to the discussion, I'm struck by the fact that it hasn't changed a great deal in the past 5 years, and that it doesn't incorporate either the experts in the field, or actual testing. In fact, what strikes me most about these conversations is that the primary concern about "memory footprints" in many cases comes from the folks who "don't have the time" to conduct the very research and quantitative analysis that they seem to be asking for. I think that for the most part, many of use accept the fact that there, yes, Virginia, there is a Santa...I mean, there will be memory footprints of our live response actions, but that it is impossible to quantify the content that is overwritten.
I think that we can agree that memory pages (and content, given pool allocations, which are smaller than a 4K memory page) are consumed during live response. I think that we can also agree that from a technical perspective, while some pages may be swapped out to the page file, the only pages that will actually be consumed or overwritten with new content, and their old content will no longer be available (either in physical memory or in the page file) are those marked as available by the operating system. From an analyst's perspective, this is similar to what happens when files are deleted from a disk, and sectors used by those files are overwritten. This will lead to instances in which you can "see" data available in a RAM dump (through the use of such tools as strings or grep), but as the content may be in pages marked available for use, that data will have little context (if any) as it cannot be associated with a specific process, thread, etc.
So we got to talking about the effect that just the first tool will have on memory...whichever tool you choose to use to dump the contents of physical memory, be it F-Response, FastDump, mdd, win32dd, winen, Memoryze, or if you choose to kick it old school on XP, an old, unsupported copy of dd.exe. Regardless, when you launch the tool, the EXE is loaded into memory to be run, establishing a presence in memory and a "footprint". This is something that cannot be avoided...you cannot interact with a live system without having some effect on the system. Responders should also be aware that the converse is true...during incident response for something like a major data breach (not naming names here...
When the EXE is loaded into memory, it consumes pages that have been marked as available; these pages are not currently in use, but may contain remnants that may be valuable later in the examination, much like artifacts found in unallocated space on the hard drive. This is somewhat intuitive, if you think about it...if Windows were to launch a new process using pages already in use by another process, then you'd have random crashes all over the place. Depending on the amount of memory in the system, the memory manager may need to write some of the pages being used by other processes out to the pagefile/swap file in order to free up space...but again, the new process will not consume pages currently being used by another process.
I know that this is an overly simplistic view of the whole process, but its meant to illustrate a point...that point being that there's a LOT of discussion about "memory footprints" of various tools, but when I listen to the discussion, I'm struck by the fact that it hasn't changed a great deal in the past 5 years, and that it doesn't incorporate either the experts in the field, or actual testing. In fact, what strikes me most about these conversations is that the primary concern about "memory footprints" in many cases comes from the folks who "don't have the time" to conduct the very research and quantitative analysis that they seem to be asking for. I think that for the most part, many of use accept the fact that there, yes, Virginia, there is a Santa...I mean, there will be memory footprints of our live response actions, but that it is impossible to quantify the content that is overwritten.
I think that we can agree that memory pages (and content, given pool allocations, which are smaller than a 4K memory page) are consumed during live response. I think that we can also agree that from a technical perspective, while some pages may be swapped out to the page file, the only pages that will actually be consumed or overwritten with new content, and their old content will no longer be available (either in physical memory or in the page file) are those marked as available by the operating system. From an analyst's perspective, this is similar to what happens when files are deleted from a disk, and sectors used by those files are overwritten. This will lead to instances in which you can "see" data available in a RAM dump (through the use of such tools as strings or grep), but as the content may be in pages marked available for use, that data will have little context (if any) as it cannot be associated with a specific process, thread, etc.
Subscribe to:
Posts (Atom)