Yes, it does, and sometimes smaller is better.
Here's why...the other day I was "doing" some analysis, trying to develop some situational awareness from an image of a Windows 2008 SP2 system. To do so, I extracted data from the image...directory listing of the partition via FTK Imager, Windows Event Logs, and Registry hive files. I then used this data to create a micro-timeline (one based on limited data) so that I could just get a general "lay of the land", if you will.
One of the things I did was open the timeline in Notepad++, run the slider bar to the bottom of the file, and search (going "up" in the file) for "Security-Auditing/". I did this to see where the oldest event from the Security Event Log would be located. Again, I was doing this for situational awareness.
Just to keep track, from the point where I had the extracted data sources, I was now just under 15 min into my analysis.
The next thing I did was go all the way back to the top of the file, and I started searching for the tags included in eventmap.txt. I started with "[maldetect]", and immediately found clusters of malware detections via the installed AV product.
Still under 18 min at this point.
Then I noticed something interesting...there was as section of the timeline that had just a bunch of failed login attempts (Microsoft-Windows-Security-Auditing/4625 events), all of them type 10 logins. I knew that one of the things about this case was unauthorized logins via Terminal Services, and seeing the failed login attempts helped me narrow down some aspects of that; specifically, the failed login attempts originated from a limited number of IP addresses, but there were multiple attempts, many using user names that didn't exist on the system...someone was scanning and attempting to brute force a login.
I already knew from the pre-engagement conference calls that there were two user accounts that were of primary interest...one was a legit account the adversary had taken over, the other was one the adversary had reportedly created. I searched for one of those and started to see "Microsoft-Windows-Security-Auditing/4778" (session reconnect) and /4779 (session disconnect) events. I had my events file, so I typed the commands:
type events.txt | find "Microsoft-Windows-Security-Auditing/4778" > sec_events.txt
type events.txt | find "Microsoft-Windows-Security-Auditing/4779" >> sec_events.txt
From there, I wrote a quick script that ran through the sec_events.txt file and gave me a count of how many times various system names and IP addresses appeared together. From the output of the script, I could see that for some system names, ones that were unique (i.e., "Hustler", etc., but NOT "Dell-PC") were all connecting from the same range of IP addresses.
From the time that I had the data available, to the point where I was looking at the output of the script was just under 45 min. Some of that time included noodling over how best to present what I was looking for, so that I didn't have to go through things manually...make the code do alphabetical sorting rather than having to it myself, that sort of thing.
The point of all this is that sometimes, you don't need a full system timeline, using all of the available data, in order to make headway in your analysis. Sometimes a micro-timeline is much better, as it doesn't include all the "noise" associated with a bunch of unrelated activity. And there are times when a nano-timeline is a vastly superior resource.
As a side note, after all of this was done, I extracted the NTUSER.DAT files for the two user profiles of interest from the image, added the UserAssist information from each of them to the main events file, and recreated the original timeline with new data...total time to do that was less than 10 min, and I was being lazy. That one small action really crystallized the picture of activity on the system.
Addendum, 27 Sept:
Here's another useful command line that I used to get logon data:
type events.txt | find "Security-Auditing/4624" | find "admin123" | find ",10"
Thursday, September 22, 2016
Monday, September 19, 2016
Links/Updates
Malicious Office Documents
Okay, my last post really doesn't seem to have sparked too much interest; it went over like a sack of hammers. Too bad. Personally, I thought it was pretty fascinating, and can see the potential for additional work further on down the road. I engaged in the work to help develop a clearer threat intel picture, and there has simply been no interest. Oh, well.
Not long ago, I found this pretty comprehensive post regarding malicious Office documents, and it covers both pre- and post-2007 formats.
What's in your WPAD?
At one point in my career, I was a security admin in an FTE position within a company. One of the things I was doing was mapping the infrastructure and determining ingress/egress points, and I ran across a system that actually had persistent routes enabled via the Registry. As such, I've always tried to be cognizant of anything that would redirect a system to a route or location other than what was intended. For example, when responding to an apparent drive-by downloader attack, I'd be sure to examine not only the web history but also the user Favorites or Bookmarks; there have been several times where doing this sort of analysis has added a slightly different shade to the investigation.
Other examples of this include things like modifications to the hosts file. Windows uses the hosts file for name resolution, and I've used this in conjunction with a Scheduled Task, as a sort of "parental control", leaving the WiFi up after 10pm for a middle schooler, but redirecting some sites to localhost. Using that knowledge over the years, I've also examined the hosts file for indicators of untoward activity; I even had a plugin for the Forensic Scanner that would automatically extract any entries in the hosts file what was other than the default. Pretty slick.
Not new...this one is over four years old...but I ran across this post on the NetSec blog, and thought that it was worth mentioning. Sometimes, you just have to know what you're looking for when performing incident response, and sometimes what you're looking for isn't in memory, or in a packet capture.
Speaking of checking things related to the browser, I saw something that @DanielleEveIR tweeted recently, specifically:

I thought this was pretty interesting, not something I'd seen or thought of before. Unfortunately, many of the malware RE folks I know are focused more on the network than the host, so things such as modifications of Registry values tend to fall through the cracks. However, if you're running Carbon Black, this might make a pretty good watchlist item, eh?
I did a search and found a malware sample described here that exhibits this behavior, and I found another description here. Hopefully, that might provide some sort of idea as to how pervasive this artifact is.
@DanielleEveIR had another interesting tweet, stating that if your app makes a copy of itself and then launches the copy, it might be malware. Okay, she's starting to sound like the Jeff Foxworthy of IR..."you might be malware if..."...but she has a very good point. Our team recently saw the LaZagne credential theft tool being run in an infrastructure, and if you've ever seen or tested this, that's exactly what it does. This would make a good watchlist item, as well...regardless of what the application name is, if the process name is the same as the parent process name, flag that puppy! You can also include this in any script that you use that parses Security Event Logs (for event ID 4688) or Sysmon Event Logs.
Defender Bias
There've been a number of blog posts that have discussed analyst bias when it comes to DFIR, threat intel, and attribution.
Something that I haven't seen discussed much is blue team or defender bias. Wait...what? What is "defender bias"? Let's look at some examples...you're sitting in a meeting, discussing an incident that your team is investigating, and you're fully aware that you don't have all the data at this point. You're looking at a few indicators, maybe some files and Windows Event Log records, and then someone says, "...if I were the bad guy, I'd...". Ever have that happen? Being an incident responder for about 17 years, I've heard that phrase spoken. A lot. Sometimes by members of my team, sometimes by members of the client's team.
Another place that defender bias can be seen is when discussing "crown jewels". One of the recommended exercises while developing a CSIRP is to determine where the critical data for the organization is located within the infrastructure, and then develop response plans around that data. The idea of this exercise is to accept that breaches are inevitable, and collapse the perimeter around the critical data that the organization relies on to function.
But what happens when you don't have the instrumentation and visibility to determine what the bad guy is actually doing? You'll likely focus on protected that critical data while the bad guy is siphoning off what they came for.
The point is that what may be critical to you, to your business, may not be the "crown jewels" from the perspective of the adversary. Going back as far as we can remember, reports from various consulting organizations have referred to the adversary as having a "shopping list", and while your organization may be on that list, the real question isn't just, "..where are your critical assets?", it's also "...what is the adversary actually doing?"
What if your "crown jewels" aren't what the adversary is after, and your infrastructure is a conduit to someone else's infrastructure? What if your "crown jewels" are the latest and greatest tech that your company has on the drawing boards, and the adversary is instead after the older gen stuff, the tech shown to work and with a documented history and track record of reliability? Or, what if your "crown jewels" are legal positions for clients, and the adversary is after your escrow account?
My point is that there is going to be a certain amount of defender bias in play, but it's critical for organizations to have situational awareness, and to also realize when there are gaps in that situational awareness. What you decide are the "crown jewels", in complete isolation from any other input, may not be what the adversary is after. You'll find yourself hunkered down in your Maginot Line bunkers, awaiting that final assault, only to be mystified when it never seems to come.
Sunday, September 11, 2016
OLE...OLE, OLE, OLE!

I recently posted an update blog that included a brief discussion of a tool I was working on, and why. In short, and due in part to a recently publicized change in tactics, I wanted to dust off some old code I'd written and see what information or intel I could collect.
The tactic I'm referring to involves the use of malware delivered via '.pub' files. I wasn't entirely too interested in this tactic until I found out that .pub (MS Publisher) files are OLE format files.
The code I'm referring to is wmd.pl, something I wrote a while back (according to the header information, the code is just about 10 yrs old!) and was written specifically to parse documents created using older versions of MS Word, specifically those that used OLE.
OLE
The Object Linking and Embedding (OLE) file format is pretty well documented at the MS site, so I won't spend a lot of time discussing the details here. However, I will say that MS has referred to the file format as a "file system within a file", and that's exactly what it is. If you look at the format, there's actually a 'sector allocation table', and it's laid out very similar to the FAT file system. Also, at some levels of the 'file system' structure, there are time stamps, as well. Now, the exact details of when and how these time stamps are created and/or modified (or if they are, at all) isn't exactly clear, but they can serve as an indicator, and something that we can incorporate with other artifacts such that when combining them with context, we can get a better idea of their validity and value.
For most of us who have been in the IR business for a while, when we hear "OLE", we think of the Blair document, and in particular, the file format used for pre-2007 versions of MS Office documents. Further, many of us thought that with the release of Office 2007, the file format was going to disappear, and at most, we'd maybe have to dust off some tools or analysis techniques at some point in the future. Wow, talk about a surprise! Not only did the file format not disappear, as of Windows 7, we started to see it being used in more and more of the artifacts we were seeing on the system. Take a look at the OLE Compound File page on the ForensicWiki for a list of the files on Windows systems that utilize the OLE file format (i.e., StickyNotes, auto JumpLists, etc.). So, rather than "going away", the file format has become more pervasive over time. This is pretty fascinating, particularly if you have a detailed understanding of the file structure format. In most cases when you're looking at these files on a Windows system, the contents of the files will be what you're most interested in; for example, with automatic Jump Lists, we may be most interested in the DestList stream. However, when an OLE compound file is created off of the system, perhaps through the use of an application, we (as analysts) would be very interested in learning all we can about the file itself.

Tools
So, the idea behind the tool I was working on was to pull apart one component of the overall attack to see if there were any correlations to the same component with respect other attacks. I'm not going to suggest it's the same thing (because it's not) but the idea I was working from is similar to pulling a device apart and breaking down its components in order to identify the builder, or at the very least to learn a little bit more that could be applied to an overall threat intel picture.
Here's what we're looking at...in this case, the .pub files are arriving as email attachments, so you have a sender email address, contents of the email header and body, attachment name, etc. All of this helps us build a picture of the threat. Is the content of the email body pretty generic, or is it specifically written to illicit the desired response (opening the attachment) from the user to whom it was sent? Is it targeted? Is it spam or spear-phishing/whaling?
Then we have what occurs after the user opens the attachment; in some cases, we see that files are downloaded and native commands (i.e., bitsadmin.exe) are executed on the system. Some folks have already been researching those areas or aspects of the overall attacks, and started pulling together things such as sites and files accessed by bitsadmin.exe, etc.
Knowing a bit about the file format of the attachment, I thought I'd take an approach similar to what Kevin talked about in his Continuing Evolution of Samas Ransomware blog post. In particular, why not see if I could develop some information that could be mapped to other aspects of the attacks? Folks were already using Didier's oledump.py to extract information about the .pub files, as well as extract the embedded macros, but I wanted to take a bit of a closer look at the file structure itself. As such, I collected a number of .pub files that were known to be malicious in nature and contain embedded macros (using open sources), and began to run the tool I'd written (oledmp.pl) across the various files, looking not only for commonalities, but differences, as well. Here are some of the things I found:
All of the files had different time stamps; within each file, all of the "directory" streams had the same time stamp. For example, from one file:
Root Entry Date: 30.06.2016, 22:03:16
All of the "directory" streams below the Root Entry had the same time stamp, as illustrated in the following image (different file from the one with 30 June time stamps):
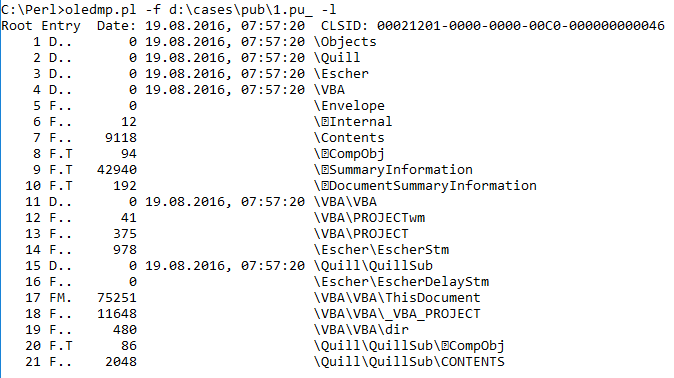 |
| .pub file structure listing |
Some of the files had a populated "Authress:" entry in the SummaryInformation section. However, with the exception of those files, the SummaryInformation and DocumentSummaryInformation streams were blank.
All of the files had Trash sections (again, see the document structure specification) that were blank.
 |
| Trash Sections Listed |
Many (albeit not all) files contained a second stream with an embedded macro. In all cases within the sample set, the stream was named "Module1", and contained an empty function. However, in each case, that empty function had a different name.
Some of the streams of all of the files were identical across the sample set. For example, the \Quill\QuillSub\ \x01CompObj stream for all of the files appears as you see in the image below.
 |
| \Quill\QuillSub\ \x01CompObj stream |
All in all, for me, this was some pretty fascinating work. I'm sure that there may be even more information to collect with a larger sample set. In addition, there's more research to be done...for example, how do these files compare to legitimate, non-malicious Publisher files? What tools can be used to create these files?
Wednesday, September 07, 2016
More Updates
Timelines
Mari had a great post recently that touched on the topic of timelines, which also happens to be the topic of her presentation at the recent HTCIA conference (which, by all Twitter accounts, we very well received).
A little treasure that Mari added to the blog post was how she went about modifying a Volatility plugin in order to create a new one. Mari says in the post, "...nothing earth shattering...", but you know what, sometimes the best and most valuable things aren't earth shattering at all. In just a few minutes, Mari created a new plugin, and it also happens to be her first Volatility plugin. She shared her process, and you can see the code right there in the blog post.
Scripting
Speaking of sharing..well, this has to do with DFIR in general, but not Windows specifically...I ran across this fascinating blog post recently. In short, the author developed a means (using Python) for turning listings of cell tower locations (pulled from phones by Cellebrite) into a Google Map.
A while back, I'd written and shared a Perl script that did something similar, except with WiFi access points.
The point is that someone had a need and developed a tool and/or process for (semi-)automatically parsing and processing the original raw data into a final, useful output format.
.pub files
I ran across this ISC Handler Diary recently...pretty interesting stuff. Has anyone seen or looked at this from a process creation perspective? The .pub files are OLE compound "structured storage" files, so has anyone captured information from endpoints (IRL, or via a VM) that illustrates what happens when these files are launched?
For detection of these files within an acquired image, there are some really good Python tools available that are good for generally parsing OLE files. For example, there's Didier's oledump.py, as well as decalage/oletools. I really like oledump.py, and have tried using it for various testing purposes in the past, usually using files either from actual cases (after the fact), or test documents downloaded from public sources.
A while back I wrote some code (i.e., wmd.pl) specifically to parse OLE structured storage files, so I modified that code to essentially recurse through the OLE file structure, and when getting to a stream, simply dump the stream to STDOUT in a hex-dump format. However, as I'm digging through the API, there's some interesting information available embedded within the file structure itself. So, while I'm using Didier's oledump.py as a comparison for testing, I'm not entirely interested in replicating the great work that he's done already, as much as I'm looking for new things to pull out, and new ways to use the information, such as pulling out date information (for possible inclusion in a timeline, or inclusion in threat intelligence), etc.
So I downloaded a sample found on VirusTotal, and renamed the local copy to be more inline with the name of the file that was submitted to VT.
Here's the output of oledump.py, when run across the downloaded file:
Now, here's the output from ole2.pl, the current iteration of the OLE parsing tool that I'm working on, when run against the same file:
As you can see, there are more than a few differences in the outputs, but that doesn't mean that there's anything wrong with either tool. In fact, it's quite the opposite. Oledump.py uses a different technique for tracking the various streams in the file; ole2.pl uses the designators from within the file itself.
The output of ole2.pl has 5 columns:
- the stream designator (from within the file itself)
- a tuple that tells me:
- is the stream a "file" (F) or a "directory" (D)
- if the stream contains a macro
- the "type" (from here); basically, is the property a PropertySet?
- the date (OLE VT_DATE format is explained here)
Part of the reason I wrote this script was to see which sections within the OLE file structure had dates associated with them, as perhaps that information can be used as part of building the threat intel picture of an incident. The script has embedded code to display the contents of each of the streams in a hex-dump format; I've disabled the code as I'm considering adding options for selecting specific streams to dump.
Both tools use the same technique for determining if macros exist in a stream (something I found at the VBA_Tools site).
One thing I haven't done is added code to look at the "trash" (described here) within the file format. I'm not entirely sure how useful something like this would be, but hey, it may be something worth looking at. There are still more capabilities I'm planning to add to this tool, because what I'm looking at is digging into the structure of the file format itself in order to see if I can develop indicators, which can then be clustered with other indicators. For example, the use of .pub file attachments has been seen by others (ex: MyOnlineSecurity) being delivered via specific emails. At this point, we have things such as the sender address, email content, name of the attachment, etc. Still others (ex: MoradLabs) have shared the results of dynamic analysis; in this case, the embedded macro launching bitsadmin.exe with specific parameters. Including attachment "tooling" may help provide additional insight into the use of this tactic by the adversary.
Something else I haven't implemented (yet) is extracting and displaying the macros. According to this site, the macros are compressed, and I have yet to find anything that will let me easily extract and decompress a macro from the stream in which its embedded, using Perl. Didier has done it in Python, so perhaps that's something I'll leave to his tool.
Threat Intel
I read this rather fascinating Cisco Continuum article recently, and I have to say, I'm still trying to digest it. Part of the reason for this is that the author says some things I agree with, but I need to go back and make sure I understand what they're saying, as I might be agreeing while at the same time misunderstanding what's being said.
A big take-away from the article was:
Where a team like Cisco’s Talos and products like AMP or SourceFire really has the advantage, Reid said, is in automating a lot of these processes for customers and applying them to security products that customers are already using. That’s where the future of threat intelligence, cybersecurity products and strategies are headed.
Regardless of the team or products, where we seem to be now is that processes are being automated and applied to devices and systems that clients are already using, in many cases because the company sold the client the devices, as part of a service.
Mari had a great post recently that touched on the topic of timelines, which also happens to be the topic of her presentation at the recent HTCIA conference (which, by all Twitter accounts, we very well received).
A little treasure that Mari added to the blog post was how she went about modifying a Volatility plugin in order to create a new one. Mari says in the post, "...nothing earth shattering...", but you know what, sometimes the best and most valuable things aren't earth shattering at all. In just a few minutes, Mari created a new plugin, and it also happens to be her first Volatility plugin. She shared her process, and you can see the code right there in the blog post.
Scripting
Speaking of sharing..well, this has to do with DFIR in general, but not Windows specifically...I ran across this fascinating blog post recently. In short, the author developed a means (using Python) for turning listings of cell tower locations (pulled from phones by Cellebrite) into a Google Map.
A while back, I'd written and shared a Perl script that did something similar, except with WiFi access points.
The point is that someone had a need and developed a tool and/or process for (semi-)automatically parsing and processing the original raw data into a final, useful output format.
.pub files
I ran across this ISC Handler Diary recently...pretty interesting stuff. Has anyone seen or looked at this from a process creation perspective? The .pub files are OLE compound "structured storage" files, so has anyone captured information from endpoints (IRL, or via a VM) that illustrates what happens when these files are launched?
For detection of these files within an acquired image, there are some really good Python tools available that are good for generally parsing OLE files. For example, there's Didier's oledump.py, as well as decalage/oletools. I really like oledump.py, and have tried using it for various testing purposes in the past, usually using files either from actual cases (after the fact), or test documents downloaded from public sources.
A while back I wrote some code (i.e., wmd.pl) specifically to parse OLE structured storage files, so I modified that code to essentially recurse through the OLE file structure, and when getting to a stream, simply dump the stream to STDOUT in a hex-dump format. However, as I'm digging through the API, there's some interesting information available embedded within the file structure itself. So, while I'm using Didier's oledump.py as a comparison for testing, I'm not entirely interested in replicating the great work that he's done already, as much as I'm looking for new things to pull out, and new ways to use the information, such as pulling out date information (for possible inclusion in a timeline, or inclusion in threat intelligence), etc.
So I downloaded a sample found on VirusTotal, and renamed the local copy to be more inline with the name of the file that was submitted to VT.
Here's the output of oledump.py, when run across the downloaded file:
 |
| Oledump.py output |
Now, here's the output from ole2.pl, the current iteration of the OLE parsing tool that I'm working on, when run against the same file:
 |
| Ole2.pl output |
As you can see, there are more than a few differences in the outputs, but that doesn't mean that there's anything wrong with either tool. In fact, it's quite the opposite. Oledump.py uses a different technique for tracking the various streams in the file; ole2.pl uses the designators from within the file itself.
The output of ole2.pl has 5 columns:
- the stream designator (from within the file itself)
- a tuple that tells me:
- is the stream a "file" (F) or a "directory" (D)
- if the stream contains a macro
- the "type" (from here); basically, is the property a PropertySet?
- the date (OLE VT_DATE format is explained here)
Part of the reason I wrote this script was to see which sections within the OLE file structure had dates associated with them, as perhaps that information can be used as part of building the threat intel picture of an incident. The script has embedded code to display the contents of each of the streams in a hex-dump format; I've disabled the code as I'm considering adding options for selecting specific streams to dump.
Both tools use the same technique for determining if macros exist in a stream (something I found at the VBA_Tools site).
One thing I haven't done is added code to look at the "trash" (described here) within the file format. I'm not entirely sure how useful something like this would be, but hey, it may be something worth looking at. There are still more capabilities I'm planning to add to this tool, because what I'm looking at is digging into the structure of the file format itself in order to see if I can develop indicators, which can then be clustered with other indicators. For example, the use of .pub file attachments has been seen by others (ex: MyOnlineSecurity) being delivered via specific emails. At this point, we have things such as the sender address, email content, name of the attachment, etc. Still others (ex: MoradLabs) have shared the results of dynamic analysis; in this case, the embedded macro launching bitsadmin.exe with specific parameters. Including attachment "tooling" may help provide additional insight into the use of this tactic by the adversary.
Something else I haven't implemented (yet) is extracting and displaying the macros. According to this site, the macros are compressed, and I have yet to find anything that will let me easily extract and decompress a macro from the stream in which its embedded, using Perl. Didier has done it in Python, so perhaps that's something I'll leave to his tool.
Threat Intel
I read this rather fascinating Cisco Continuum article recently, and I have to say, I'm still trying to digest it. Part of the reason for this is that the author says some things I agree with, but I need to go back and make sure I understand what they're saying, as I might be agreeing while at the same time misunderstanding what's being said.
A big take-away from the article was:
Where a team like Cisco’s Talos and products like AMP or SourceFire really has the advantage, Reid said, is in automating a lot of these processes for customers and applying them to security products that customers are already using. That’s where the future of threat intelligence, cybersecurity products and strategies are headed.
Regardless of the team or products, where we seem to be now is that processes are being automated and applied to devices and systems that clients are already using, in many cases because the company sold the client the devices, as part of a service.
Saturday, September 03, 2016
Updates
Registry Settings
Microsoft TechNet had a blog post recently regarding malware setting the IE proxy settings by modifying the "AutoConfigURL" value. That value sounded pretty familiar, so I did a quick search of my local repository of plugins:
C:\Perl\rr\plugins>findstr /C:"autoconfigurl" /i *.pl
I came up with one plugin, ie_settings.pl, that contained the value name, and specifically contained this line:
ie_settings.pl:# 20130328 - added "AutoConfigURL" value info
Pretty fascinating to have an entry added to a plugin 3 1/2 years ago still be of value today.
Speaking of the Registry, I saw a tweet recently indicating that the folks at Volatility had updated the svcscan module to retrieve the service setting for what happens when the services fails to start. This is pretty interesting...I haven't seen this value having been set or used during an engagement. However, I am curious...what Windows Event Log record is generated when a service fails to start? Is there more than one? According to Microsoft, there are a number of event IDs related to service failures of various types. The question is, is there one (or two) in particular that I should look for, with respect to this Registry value? For example, if I were creating a timeline of system activity and included the contents of the System Event Log, which event IDs (likely from source "Service Control Manager") would I be most interested in, in this case?
Outlook Rulez
Jamie (@gleeda) recently RT'd an interesting tweet from MWR Labs regarding a tool that they'd created to set malicious Outlook rules for persistence.
I was going to say, "hey, this is pretty fascinating...", but I can't. Here's why...SilentBreak Security talked about malicious Outlook rules, as have others. In fact, if you read the MWRLabs blog post, you'll see that this is something that's been talked about and demonstrated going back as far as 2008...and that's just the publicly available stuff.
Imagine compromising an infrastructure and leaving something in place that you could control via a text message or email. Well, many admins would look at this and think, "well, yeah, but you need this level of access, and you then have to have this..."...well, now it's just in a single .exe file, and can be achieved with command line access.
I know, this isn't the only way to do this...and apparently, it's not the only tool available to do it, either. However, it does represent a means for retaining access to a high-value infrastructure, even following eviction/eradication. Imagine working very hard (and very long hours) to scope, contain, and clean up after a breach, only to have the adversary return, seemingly at will. And to make matters even more difficult, the command used could easily include a sleep() function, so it's even harder to tie back the return to the infrastructure to a specific event without knowing that the rule exists.
Webshells
Doing threat hunting and threat response, I see web shells being used now and again. I've seen web shells as part of a legacy breach that predated the one we were investigating, and I've seen infrastructures rife with web shells. I've seen a web shell used internally within an infrastructure to move laterally (yeah, no idea about that one, as to "why"...), and I've seen where an employee would regularly find and remove the web shell but not do an RCA and remediate the method used to get the web shell on the system; as long as the vulnerability persists, so does the adversary.
I caught this pretty fascinating description of a new variant of the China Chopper web shell, called "CKnife", recently. I have to wonder, has anyone else seen this, and if so, do you know what it "looks like" if you're monitoring process creation events (via Carbon Black, Sysmon, etc.) on the system?
Tool Testing
Eric Zimmerman recently shared the results of some pretty extensive tool testing via his blog, and appeared on the Forensic Lunch with David and Matt, to discuss his testing. I applaud and greatly appreciate Eric's efforts in putting this together...it was clearly a great deal of work to set the tests up, run them, and then document them.
I am, however, one of those folks who won't find a great deal of value in all of that work. I can't say that I've done, or needed to do, a keyword search in a long time. When I have had to perform a keyword search, or file carving, I tend to leave long running tasks such as these for after-hours work, so if it finishes in 6 1/2 hrs, or 8 hrs, really isn't too big a deal for me.
A great deal of the work that I do involves creating timelines of all sizes (Mari recently gave a talk on creating mini-timelines at HTCIA). I've created timelines from just the contents of the Security Event Log, to using metadata from multiple sources (file system, Windows Event Logs, Registry, etc.) from within an image. If I need to illustrate how and when a user account was used to log into a system, then download and view image files, I don't need a full commercial suite to do this...and a keyword search isn't going to give me any thing of value.
That's not to say that I haven't looked for specific strings. However, when I do, I tend to take a targeted approach, extracting the data source (pagefile, unallocated space, etc.) from the image, running strings, and then searching for specific items (strings, substrings, etc.) in the output.
Again...and don't misunderstand...I think that what Eric did was some really great work. He would not have done it if it wasn't of significant value to him, and I have no doubt in my mind that he shared it because it will have significant value to others.
Sunday, August 28, 2016
Links and Updates
Corporate Blogs
Two cool things about my day job is that I see cool things, and get to share some of what is seen through the SecureWorks corporate blog. Most of my day job can be described as DFIR and threat hunting, and all of the stuff that goes into doing those things. We see some pretty fascinating things and it's really awesome that we get to share them.
Some really good examples of stuff that our team has seen can be found here, thanks to Phil. Now and again, we see stuff and someone will write up a corporate blog post to share what we saw. For example, here's an instance where we saw an adversary create and attempt to access a new virtual machine. Fortunately, the new VM was created on a system that was itself a VM...so the new VM couldn't be launched.
In another example, we saw an adversary launch an encoded and compressed PowerShell script via a web shell, in order to collect SQL system identifiers and credentials. The adversary had limited privileges and access via the web shell (it wasn't running with System level privileges), but may have been able to use native tools to run commands at elevated privileges on the database servers.
Some other really good blog posts include (but are not limited to):
A Novel WMI Persistence Implementation
The Continuing Evolution of Samas Ransomware (I really like this one...)
Ransomware Deployed by Adversary with Established Foothold
Ransomware as a Distraction
VSCs
I watched Ryan Nolette's BSidesBoston2016 presentation recently, in part because the title and description caught my attention. However, at the end of the presentation, I was mystified by a couple of things, but some research and asking some questions cleared it up. Ryan's presentation was based on a ransomware sample that had been discussed on the Cb blog on 3 Aug 2015...so by the time the BSides presentation went on, the blog post was almost a year old.
During the presentation, Ryan talked about bad guys using vshadow.exe (I found binaries here) to create a persistent shadow copy, mounting that copy (via mklink.exe), copying malware to the mounted VSC and executing it, and then deleting all VSCs. Ryan said that after all of that, the malware was still running. However, the process discussed in the presentation wasn't quite right...if you want the real process, you need to look at this Cb blog post from 5 Aug 2015.
This is a pretty interesting technique, and given that it was discussed last year (it was likely utilized and observed prior to that) it makes me wonder if perhaps I've missed it in my own investigations...which then got me to thinking, how would I find this during a DFIR investigation? Ryan was pretty clear as to how he uses Cb to detect this sort of activity, but not all endpoint tools have the same capabilities as Cb. I'll have to look into some further testing to see about how to detect this sort of activity through analysis of an acquired image.
Saturday, August 13, 2016
LANDesk in the Registry
LANDesk in the Registry
Some of my co-workers recently became aware of information maintained in the Windows Registry by the LANDesk softmon utility, which is pretty fascinating when you look at it. The previously-linked post states that, "LANDesk Softmon.exe monitors application execution..."...so not just installed applications, or just services, but application execution. The post goes on to state:
Unfortunately, if an application is no longer available the usage information still lives on in the registry.
This goes back to what I've said before about indicators on Windows systems, particularly within the Registry, persisting beyond the deletion or removal of the application, which is pretty awesome.
The softmon utility maintains some basic information about the executed apps within the Software hive, with subkeys named for the path to the app. The path to the keys in question is:
HKLM\SOFTWARE\[Wow6432Node]\LANDesk\ManagementSuite\WinClient\SoftwareMonitoring\
MonitorLog\<path to executed app>
Information maintained within the keys includes the following values:
This information isn't nearly as comprehensive as something like Sysmon, of course, but it's much better than nothing.
Sysforensics posted a LANDesk Registry Entry Parser script on GitHub, about 2 yrs ago. Don Weber wrote the original landesk.pl RegRipper plugin back in 2009, and I made some updates to it in 2013. There's also a landesk_tln.pl plugin that incorporates the data into a timeline.
Some of my co-workers recently became aware of information maintained in the Windows Registry by the LANDesk softmon utility, which is pretty fascinating when you look at it. The previously-linked post states that, "LANDesk Softmon.exe monitors application execution..."...so not just installed applications, or just services, but application execution. The post goes on to state:
Unfortunately, if an application is no longer available the usage information still lives on in the registry.
This goes back to what I've said before about indicators on Windows systems, particularly within the Registry, persisting beyond the deletion or removal of the application, which is pretty awesome.
The softmon utility maintains some basic information about the executed apps within the Software hive, with subkeys named for the path to the app. The path to the keys in question is:
HKLM\SOFTWARE\[Wow6432Node]\LANDesk\ManagementSuite\WinClient\SoftwareMonitoring\
MonitorLog\<path to executed app>
Information maintained within the keys includes the following values:
- Current User
- First Started
- Last Started
- Last Duration
- Total Duration
- Total Runs
This information isn't nearly as comprehensive as something like Sysmon, of course, but it's much better than nothing.
Sysforensics posted a LANDesk Registry Entry Parser script on GitHub, about 2 yrs ago. Don Weber wrote the original landesk.pl RegRipper plugin back in 2009, and I made some updates to it in 2013. There's also a landesk_tln.pl plugin that incorporates the data into a timeline.
Wednesday, August 10, 2016
Links
Data Exfil
A question that analysts get from time to time is "was any data exfiltrated from this system?" Sometimes, this can be easy to determine; for example, if the compromised system had a web server running (and was accessible from the Interwebs), you might find indications of GET requests for unusual files in the web server logs. You would usually expect to find something like this if the bad guy archived whatever they'd collected, moved the archive(s) into a web folder, and then issued a GET request to download the archive to their local system. In many cases, the bad guy has then deleted the archive. With no instrumentation on the system, the only place you will find any indication of this activity is in the web server logs.
However, for the most part, definitive determination of data exfiltration is almost impossible without the appropriate instrumentation; either having a packet sniffer on the wire at the time of the transfer, or appropriate endpoint agent monitoring process creation events (see the Endpoints section below) in order to catch/record command lines. In the case of endpoint monitoring, you'd likely see the use of an archiving tool, and little else until you moved to the web server logs (given the above example).
Another area to look is the Background Intelligent Transfer Service, or "BITS". SecureWorks has a very interesting blog post that illustrates one way that this native Windows service has been abused. I highly suggest that if you're doing any kind of DFIR or threat hunting work, you do a good, solid read of the SecureWorks blog post.
I am not aware of any publicly-available tools for parsing the BITS qmgr0.dat or qmgr1.dat files, but you can use 'strings' to locate information of interest, and then use a hex editor from that point in order to get more specific information about the type of transfer (upload, download) that may have taken place, and it's status. Also, be sure to keep an eye on those Windows Event Logs, as well.
Finding Bad
Jack Crook recently started a new blog, Finding Bad, covering DFIR and threat hunting topics. As
Jack's most recent post on hunting for lateral movement is a good start, but IMHO, the difference in artifacts on the source vs the destination system during lateral movement needs to be clearly delineated. Yeah, I know...it may be pedantic, but from my perspective, there is actually a pretty huge difference, and that difference needs to be understood, for no other reason that because the artifacts on each system are different.
Endpoints
Adam recently posted a spreadsheet of various endpoint solutions that are available...it's interesting to see the comparison. Having detailed knowledge of one of the listed solutions does a level set with respect to my expectations regarding the others.
MAC Addresses in the Registry
I recently received a question from a friend regarding MAC addresses being stored in the Registry. It turns out, there are places where the MAC address of a system is "stored" in the Registry, just not in the way you might think. For example, running the mountdev2.pl RegRipper plugin, we see (at the bottom of the output) something like this:
Unique MAC Addresses:
80:6E:6F:6E:69:63
I should also point out that the macaddr.pl plugin, which is about 8 yrs old at this point, also might provide some information.
Registry Findings - 2012
The MAC Daddy - circa 2007
EventMonkey
I ran across EventMonkey (wiki here) recently, which is a Python-based event processing utility. What does that mean? Well, from the wiki, that means "A multiprocessing utility that processes Windows event logs and stores into SQLite database with an option to send records to Elastic for indexing." Cool.
This definitely seems like an interesting tool for DFIR analysts. Something else that the tool reportedly does is process the JSON output from Willi's EVTXtract.
Presentations
As I've mentioned before, later this month I'll be presenting at ArchC0N, discussing some of the misconceptions of ransomware. I ran across an interesting blog post recently regarding, Fixing the Culture of Infosec Presentations. I can't say that I fully agree with the concept behind the post, nor with the contents of blog post. IMHO, the identified "culture" is from too narrow a sample of conferences...it's unclear as to which "infosec conferences" this discussion applies.
I will say this...I stopped attending some conferences a while back because of the nature of how they were populated with speakers. Big-named, headliner speakers were simply given a time slot, and in some cases, did not even prepare a talk. I remember one such speaker using their time slot to talk about wicca.
At one point in the blog post, the author refers to a particular presenter who simply reads an essay that they've written; the author goes on to say that they prefer that. What's the point? If you write an essay, and it's available online, why spend your time reading it to the audience, when the audience is (or should be) fully capable of reading it themselves?
There's another statement made in the blog post that I wanted to comment on...
We have a force field up that only allows like .1% of our community to get on the stage, and that’s hurting all of us. It’s hurting the people who are too afraid to present. It’s hurting the conference attendees. And it’s hurting the conferences themselves because they’re only seeing a fraction of the great content that’s out there.
I completely agree that we're missing a lot of great content, but I do not agree that "we have put up a force field"; or, perhaps the way to look at it is that the force field is self-inflicted. I have seen some really good presentations out there, and the one thing that they all have in common is that the speaker is comfortable with public speaking. I say "self-inflicted" because there are also a lot of people in this field who are not only afraid to create a presentation and speak, they're also afraid to ask questions, or offer their own opinion on a topic.
What I've tried to do when presenting is to interact with the audience, to solicit their input and engage them. After all, being the speaker doesn't mean that I know everything...I can't possibly know or have seen as much as all of us put together. Rather than assume the preconceptions of the audience, why not ask them? Admittedly, I will sometimes ask a question, and the only sound in the room is me breathing into the mic...but after a few minutes folks tend to start loosing up a bit, and in many cases, a pretty good interactive discussion ensues. In the end, we all walk away with something.
I also do not believe that "infosec presentations" need to be limited to the rather narrow spectrum described in the blog post. Attack, defend, or a tool for doing either one. There is so much more than that out there and available. How about something new that you've seen (okay, maybe that would part of "defend"), or a new way of looking at something you've seen? Want a good example? Take a look at Kevin Strickland's blog post on the Evolution of the Samas Ransomware. At the point where he wrote that blog post, SecureWorks (full disclosure, Kevin and I are both employed by SecureWorks) had seen several Samas ransomware cases; Kevin chose to look at what we'd all seen from a different perspective.
There are conferences that have already gone to taking at least some of the advice in the blog post. For example, the last time I attended a SANS360 presentation, there were 10 speakers, each with 6 minutes to present. Some timed their presentations down to the second, while others seemed to completely ignore the 6 minute limit on presentations. Even so, it was great to see a speaker literally remove all of the fluff and focus on one specific topic, and get that across.
Sunday, July 17, 2016
Updates
Book Update
I recently and quite literally stumbled across an image online that was provided as part of a challenge, involving a compromised system. I contacted the author, as well as discussed the idea of updating the book with my tech editor, and the result of both conversations is that I will be extending the book with an additional chapter. This image is from a Windows 2008 web server that had been "compromised", and I thought it would be great to add this to the book, given the types of "cases" that were already being covered in the book.
RDP Bitmap Cache Parser
I ran across this French web site recently, and after having Google translate it for me, got a bit better view into what went into the RDP bitmap cache parsing tool. This is a pretty fascinating idea; I know that I've run across a number of cases involving the use of RDP, either by an intruder or a malicious insider, and there could have been valuable clues left behind in the bitmap cache file.
Pancake Viewer
I learned from David Dym recently that Matt (works with David Cowen) is working on something called the "pancake viewer", which is as DFVFS-backed image viewer using wxPython for the GUI. This looks like a fascinating project, and something that will likely have considerable use, particularly as the "future functionality" is added.
Web Shells
Web shells are nothing new; here is a Security Disclosures blog post regarding web shells from 3 years ago. What's "new" is what is has recently been shared on the topic of web shells.
This DFIR.IT blog post provides some references (at the bottom of the post) where other firms have discussed the use of web shells, and this post on the SecureWorks site provides insight as to how a web shell was used as a mechanism to deploy ransomware.
This DFIR.IT blog post (#3 in the series) provides a review of tools used to detect web shells.
A useful resource for Yara rules used to detect web shells includes this one by 1aNOrmus.
Wednesday, July 06, 2016
Updates and Stuff
Registry Analysis
I received a question recently, asking if it were possible to manipulate Registry key LastWrite time stamps in a manner similar to file system time stomping. Page 30 of Windows Registry Forensics addresses this; there's a Warning sidebar on that page that refers to SetRegTime, which directly answers this question.
The second part of the question was asking if I'd ever seen this in the wild, and to this point, I haven't. Then I thought to myself, how would I identify or confirm this? I think one way would be to make use of historical data within the acquired image; let's say that the key in question is available within Software hive, with a LastWrite time of 6 months prior to the image being acquired. I'd start by examining the Software hive within the RegBack folder, as well as the Software hives within any available VSCs. So, if the key has a LastWrite time of 6 months ago, and the Software hive from the RegBack folder was created 4 days ago and does NOT include any indication of the key existing, then you might have an issue where the key was created and time stomped.
Powershell Logging
I personally don't use Powershell (much, yet), but there have been times when I've been investigating a Windows system and found some entries in the Powershell Event Log that do little more than tell me that something happened. While conducting analysis, I have no idea if the use of Powershell is pervasive throughout the infrastructure, if it's something one or two admins prefer to use, or if it was used by an attacker...the limited information available by default doesn't give me much of a view into what happened on the system.
The good news is that we can fix this; FireEye provides some valuable instructions for enabling a much greater level of visibility within the Windows Event Log regarding activity that may have occurred via Powershell. This Powershell Logging Cheat Sheet provides an easy reference for enabling a lot of FireEye's recommendations.
So, what does this mean to an incident responder?
Well, if you're investigating Powershell-based attacks, it can be extremely valuable, IF Powershell has been updated and the logging configured. If you're a responder in an FTE position, then definitely push for the appropriate updates to systems, be it upgrading the Powershell installed, or upgrading the systems themselves. When dealing with an attack, visibility is everything...you don't want the attacker moving through an obvious blind spot.
This is also really valuable for testing purposes; set up your VM, upgrade the Powershell and configure logging, and then go about testing various attacks; the FireEye instructions mentioned above refer to Mimikatz.
Powershell PSReadLine Module
One of the things that's "new" to Windows 10 is the incorporation of the PSReadLine module into Powershell v5.0, which provides a configurable command history (similar to a bash_history file). Once everything's up and running correctly, the history file is found in the user profile at C:\Users\user\AppData\Roaming\Microsoft\Windows\PowerShell\PSReadline\ConsoleHost_history.txt.
For versions of Windows prior to 10, you can update Powershell and install the module.
This is something else I'd definitely upgrade, configure and enable in a testing environment.
CLI Tools
As someone who's written a number of CLI tools in Perl, I found this presentation by Brad Lhotsky to be pretty interesting.
Tool Listing
Speaking of tools, I recently ran across this listing of tools, and what caught my attention wasn't the listing itself as much as the format. I like the Windows Explorer-style listing that lets you click to see what tools are listed...pretty slick.
Ransomware
I was doing some preparation for a talking I'm giving at ArchC0N in August, and was checking out the MMPC site. The first thing I noticed was that the listing on the right-hand side of the page had 10 new malware families identified, 6 of which were ransomware.
My talk at ArchC0N is on the misconceptions of ransomware, something we saw early on in Feb and March of this year, but continue to see even now. In an attempt to get something interesting out on the topic, a number of media sites were either adding content to their articles that had little to do with what was actually happening at a site infected with ransomware, or they were simply parroting what someone else had said. This has let to a great deal of confusion as infection vectors for ransomware in general, as well as what occurred during specific incidents.
More on the Registry...
With respect to the Registry, there're more misconceptions that continue unabated, particularly from Microsoft. For example, take a look at the write-up for the ThreatFin ransomware, which states:
It can create the following registry entries to ensure it runs each time you start your PC:
The write-up then goes on to identify values added to the Run key within the HKCU hive. However, this doesn't cause the malware to run each time the system is started, but rather when that user logs into the system.
Monday, June 20, 2016
New Book
So, yeah...I'm working on another book (go figure, right?). This one is different than the previous books I've written; rather than listing the various artifacts available within an acquired image, the purpose of this book is to provide a walk-through of the investigative process, illustrate how the various artifacts can be used to complete analysis, and more importantly, illustrate and describe the various decisions made throughout the course of the examination. The focus of this book is the process, and all along the way, various "analysis decisions" will be highlighted and detailed.
The current table of contents, with a short description of each chapter, is as follows:
Chapter 1 - Introduction
Introduction to the core concepts that I'll be reinforcing throughout the remaining chapters of the book, including documentation (eeewww, I know, right?).
Chapter 2 - Malware Detection Scenarios
In Ch 2, there are two malware detection scenarios. Again, these are detection scenarios, not analysis scenarios. I will discuss somethings that an analyst can do in order to move the analysis along, documenting and confirming the malware that they found, but there are plenty of resources available that discuss malware analysis in much greater detail. One of the analysis scenarios that I've seen a great deal of during my time as a DFIR analyst has been, "...we don't for sure, but we think that this system may have malware on it..."; as such I thought that this would be a great scenario to present.
In this chapter, I will be walking through the analysis process for two scenarios, one using a WinXP image that's available online, the other using a Win7 image that's available online. That way, when reading the book, you can download a copy of the image (if you choose to do so) and follow along with the analysis process. However, the process will be detailed enough that you won't have to have the image available to follow along.
Chapter 3 - User Activity Scenarios
This chapter addresses tracking user activity during an examination, determining/following the actions that a user took while logged into the system. Of course, a "user" can also be an intruder who has either compromised an account, or created one that they're now using.
As with chapter 2, I'll be walking through two scenarios, one using a WinXP image, the other using a Win7 image, both of which are available online.
The purpose of chapters 2 and 3 is to illustrate the end-to-end analysis process; its not about this tool or that tool, its about the overall process. Throughout the scenarios, I will be presenting analysis decisions that are made, describing why I decided to go a certain direction, and illustrating what the various findings mean to the overall analysis.
Chapter 4 - Setting up and using a test environment
Many times, an analyst may need to test a hypothesis in order to confirm (or deny) the creation of an artifact or indicator. Or, the analyst may opted to test malware or malicious documents to determine what occurred on the system, and to illustrate what the user saw, and what actions the user had to have taken. In this chapter, we'll walk through setting up a virtual environment that would allow the analyst to test such things.
This may seem like a pretty obvious chapter to many...hey, this sort of thing is covered in a lot of other resources, right? Well, something I see a great deal of, even today, is that these virtual testing environments are not instrumented in a way that provides sufficient detail to allow the analyst to then collect intelligence, or propagate protection mechanisms through their environment.
This chapter is not about booting an image. There are plenty of resources out there that address this topic, covering a variety of formats (i.e., "...what if I have an *.E01 image, not a raw/dd image...?").
Chapter 5 - RTFM for DFIR
If you're familiar with the Red Team Field Manual, chapter 5 will be a DFIR version of this manual. Like RTFM, there will not be detailed explanations of the various tools; the assumption is made that you (a) already know about the tool, or (b) will put in the effort to go find out about the tool. In fact, (b) is relatively easy...sometimes just typing the name of the CLI tool at the prompt, or typing the name followed by "/?", "-h", or "--help" is all you really need to do to get a description of the tool, its syntax, and maybe even example command lines illustrating how to use the tool.
Okay, so, yeah...I know that this is a bit different from the way I've done things in the past...most often I've just posted that the book was available. With my last book, I had a "contest" to get submissions for the book...ultimately, I just got one single submission.
The reason I am posting this is due to this post from the ThisWeekIn4n6 blog, specifically this statement...
My only comment on this article is that maybe he could be slightly more transparent with how he’s going in the book writing process. I recall seeing a couple of posts about the competition, and then the next one was that he had completed the book. Unfortunately I missed the boat in passing on some research into the SAM file (by several months) however Harlan posted about it here.
With that in mind, I imagine he will be working on an update to Windows Forensic Analysis to cover some additional Windows 10 artifacts (and potentially further updates to other versions). Maybe a call out (yes, I know these haven’t been super successful in the past; maybe a call out to specific people? Or universities?)....
With respect to the Windows Registry Forensics book, I thought I was entirely "transparent"...I asked for assistance, and in the course of time...not just to the "end" of the contest time limit, but throughout the rest of the time I was writing the book...I received a single submission.
The "Ask"
Throughout the entire time that I've written books, the one recurring question that comes up over and over again is, "...does it cover Windows? " Ever time the question is asked, I have the same answer...no, because I don't have access to that version of Windows.
This time, in an attempt to head off those questions, I'm putting out a request to the DFIR community at large. Specifically, if you have access to an image of a Windows 10 system (or to an image of any of the server versions of Windows after 2003) that have been compromised in some manner (i.e., malware, unauthorized access, etc.), and are worth of investigation, can you share them? The images I'm using in this book are already available online, and I'm not asking that these images also be available online; if you don't mind sharing a copy of the images with me, I will walk through the analysis and include it in the book, and I will destroy/return the images after I'm done with them, whichever you would like.
Anyone who shares an image of a Windows server version beyond (not including) Windows 2003, or an image of a Windows 10 system, for which I can include the analysis of that image in my book will receive a free, signed (yes, by me...) copy of the book once it comes out.
Addendum: Something that I wanted to add for clarity...I do not have, nor do I have access to, any system (or an image thereof) running Cortana, or anything special. The laptop that I write the books (and blog posts) from is a Dell Latitude E6510. My point is that if you have questions such as, "what are the artifacts of someone using Cortana?" or of any other application specific to Windows 10, please understand that I do not have unlimited access to all types of equipment. This is why I made the request I did in this blog post.
The current table of contents, with a short description of each chapter, is as follows:
Chapter 1 - Introduction
Introduction to the core concepts that I'll be reinforcing throughout the remaining chapters of the book, including documentation (eeewww, I know, right?).
Chapter 2 - Malware Detection Scenarios
In Ch 2, there are two malware detection scenarios. Again, these are detection scenarios, not analysis scenarios. I will discuss somethings that an analyst can do in order to move the analysis along, documenting and confirming the malware that they found, but there are plenty of resources available that discuss malware analysis in much greater detail. One of the analysis scenarios that I've seen a great deal of during my time as a DFIR analyst has been, "...we don't for sure, but we think that this system may have malware on it..."; as such I thought that this would be a great scenario to present.
In this chapter, I will be walking through the analysis process for two scenarios, one using a WinXP image that's available online, the other using a Win7 image that's available online. That way, when reading the book, you can download a copy of the image (if you choose to do so) and follow along with the analysis process. However, the process will be detailed enough that you won't have to have the image available to follow along.
Chapter 3 - User Activity Scenarios
This chapter addresses tracking user activity during an examination, determining/following the actions that a user took while logged into the system. Of course, a "user" can also be an intruder who has either compromised an account, or created one that they're now using.
As with chapter 2, I'll be walking through two scenarios, one using a WinXP image, the other using a Win7 image, both of which are available online.
The purpose of chapters 2 and 3 is to illustrate the end-to-end analysis process; its not about this tool or that tool, its about the overall process. Throughout the scenarios, I will be presenting analysis decisions that are made, describing why I decided to go a certain direction, and illustrating what the various findings mean to the overall analysis.
Chapter 4 - Setting up and using a test environment
Many times, an analyst may need to test a hypothesis in order to confirm (or deny) the creation of an artifact or indicator. Or, the analyst may opted to test malware or malicious documents to determine what occurred on the system, and to illustrate what the user saw, and what actions the user had to have taken. In this chapter, we'll walk through setting up a virtual environment that would allow the analyst to test such things.
This may seem like a pretty obvious chapter to many...hey, this sort of thing is covered in a lot of other resources, right? Well, something I see a great deal of, even today, is that these virtual testing environments are not instrumented in a way that provides sufficient detail to allow the analyst to then collect intelligence, or propagate protection mechanisms through their environment.
This chapter is not about booting an image. There are plenty of resources out there that address this topic, covering a variety of formats (i.e., "...what if I have an *.E01 image, not a raw/dd image...?").
Chapter 5 - RTFM for DFIR
If you're familiar with the Red Team Field Manual, chapter 5 will be a DFIR version of this manual. Like RTFM, there will not be detailed explanations of the various tools; the assumption is made that you (a) already know about the tool, or (b) will put in the effort to go find out about the tool. In fact, (b) is relatively easy...sometimes just typing the name of the CLI tool at the prompt, or typing the name followed by "/?", "-h", or "--help" is all you really need to do to get a description of the tool, its syntax, and maybe even example command lines illustrating how to use the tool.
Okay, so, yeah...I know that this is a bit different from the way I've done things in the past...most often I've just posted that the book was available. With my last book, I had a "contest" to get submissions for the book...ultimately, I just got one single submission.
The reason I am posting this is due to this post from the ThisWeekIn4n6 blog, specifically this statement...
My only comment on this article is that maybe he could be slightly more transparent with how he’s going in the book writing process. I recall seeing a couple of posts about the competition, and then the next one was that he had completed the book. Unfortunately I missed the boat in passing on some research into the SAM file (by several months) however Harlan posted about it here.
With that in mind, I imagine he will be working on an update to Windows Forensic Analysis to cover some additional Windows 10 artifacts (and potentially further updates to other versions). Maybe a call out (yes, I know these haven’t been super successful in the past; maybe a call out to specific people? Or universities?)....
With respect to the Windows Registry Forensics book, I thought I was entirely "transparent"...I asked for assistance, and in the course of time...not just to the "end" of the contest time limit, but throughout the rest of the time I was writing the book...I received a single submission.
The "Ask"
Throughout the entire time that I've written books, the one recurring question that comes up over and over again is, "...does it cover Windows
This time, in an attempt to head off those questions, I'm putting out a request to the DFIR community at large. Specifically, if you have access to an image of a Windows 10 system (or to an image of any of the server versions of Windows after 2003) that have been compromised in some manner (i.e., malware, unauthorized access, etc.), and are worth of investigation, can you share them? The images I'm using in this book are already available online, and I'm not asking that these images also be available online; if you don't mind sharing a copy of the images with me, I will walk through the analysis and include it in the book, and I will destroy/return the images after I'm done with them, whichever you would like.
Anyone who shares an image of a Windows server version beyond (not including) Windows 2003, or an image of a Windows 10 system, for which I can include the analysis of that image in my book will receive a free, signed (yes, by me...) copy of the book once it comes out.
Addendum: Something that I wanted to add for clarity...I do not have, nor do I have access to, any system (or an image thereof) running Cortana, or anything special. The laptop that I write the books (and blog posts) from is a Dell Latitude E6510. My point is that if you have questions such as, "what are the artifacts of someone using Cortana?" or of any other application specific to Windows 10, please understand that I do not have unlimited access to all types of equipment. This is why I made the request I did in this blog post.
Updates

Something I caught over on Weare4n6 recently was that there's a new book on it's way out, due to be available in Oct, 2016, entitled, "Data Hiding Techniques in Windows OS". The description of the book on the blog is kind of vague, with references to steganography, but I'm hoping that it will also include discussions of things like ADSs, and using Unicode to "hide" files and Registry keys/values in plain sight.
My initial reaction to the book, however, had to do with the cover. To the right is a copy of the cover of my latest book, Windows Registry Forensics. Compare that to the book cover at the web site. In short, it looks as if Elsevier is doing it again...previous editions of my books not only had the same color scheme amongst the books, but shared that color scheme with books from other authors. This led to massive confusion; I once received a box of books just before I left for a conference, and I took a couple of copies to give away while I was there. When I tried to give the books away, people told me that they "...already had the book...", which I thought was odd because I had just received the box. It turned out that they were looking at the color scheme and not actually reading the title of the book.
Right now I have nine books on my shelf that have the same or very similar color schemes...black and green. I am the sole author, or co-author, of four of them. The other five have an identical color scheme...a slightly different shade of green...but I am the author of only one of them.
Imaging
Mari's got another great post up, this one about using a Linux distro to image a Mac. Yeah, I know, this blog isn't about Macs, but this same method could potentially be used to image a Windows server that you're having trouble with. Further, Mari is one of the very few people within the community who develops and shares original material, something the community needs to encourage with more analysts.
Carberp Updates
A couple of articles appeared recently regarding changes to Carberp (PaloAltoNetworks, TrendMicro), specifically with respect to the persistence mechanism. The PAN article mentions that this may be used to make sandbox analysis much more difficult, in that it requires user interaction to launch the malware.
The PAN article ends with a bunch of "indicators", which consist of file hashes and domain names. I'd monitor for the creation of the key/value instead.
Some online research indicated that this persistence mechanism had been discussed on the Hexacorn blog over 2 years ago. According to the blog post, the persistence mechanism causes the malware to be launched when the user launches an Office application, or IE with Office plugins installed. This can make IIV determination difficult if the analyst isn't aware of it.
I updated the malware.pl RegRipper plugin accordingly.
Wednesday, June 08, 2016
Updates
RegRipper Plugin Updates
I recently released some updates to RegRipper plugins, fixing code (IAW Eric's recent post) and releasing a couple of new plugins. As such, I thought it might be helpful to share a bit about how the plugins might be used during an exam.
lastloggedon.pl - honestly, I'm not entirely sure how I'd use this plugin during analysis, beyond using it to document basic information about the system.
shimcache.pl - I can see using this plugin for just about any engagement where the program execution category of artifacts is of interest. Remember the blog post about creating an analysis matrix? If not, think malware detection, data exfil, etc. As Eric mentioned in his recent webcast, you could use indicators you find in the ShimCache data to pivot to other data sources, such as the AmCache.hve file, Prefetch files, Windows Event Log records with sources such as "Service Control Manager" in a timeline, etc. However, the important thing to keep in mind is the context of the time stamps associated with each file entry...follow the data, don't force it to fit your theory.
Specific things I'd look for when parsing the ShimCache data include entries in the root of the Recycle Bin, the root of the user's profile, the root of the user's AppData/Roaming and Desktop folders, in C:\ProgramData, and with a UNC path (i.e., UNC\\tsclient\...). Clearly, that's not all I'd look for, but those are definitely things I'd look for and be very interested in. At one point, I'd included "alerts" in the output of some plugins that would automatically look for this sort of thing and alert the analyst to their presence, but there didn't seem to be a great deal of interest in this sort of thing.
Win10 Notification DB
During his recent webcast regarding the AmCache.hve file, Eric mentioned the SwiftForensics site a couple of times. Well, it turns out that Yogesh has been on to other things since he posted about the AmCache.hve file...he recently posted a structure description for the Windows 10 Notification database. Yogesh also included a Python script for parsing the notification database...if you're examining Windows 10 systems, you might want to check it out.
I don't have enough experience yet examining Windows 10 systems to know what sorts of things would be of value, but I can imagine that there would be considerable value in this data, in a case where the user claimed to not have received an email, only to have an examiner pull a snippet of that email from the notification database, for example.
AmCache.hve
Speaking of Yogesh's comments regarding the AmCache.hve file, one of his posts indicates that it would be a goldmine for malware hunters. As I mentioned in my previous post on the subject, in the past two months, I've examined two Windows 7 systems that were known to be infected with malware, and while I found references to the malware files in the AppCompatCache, I did not find references to the files in the AmCache.hve file.
To be clear, I'm not saying that either Yogesh's or Eric's comments are incorrect...not at all. I'm not saying that, suggesting that, or trying to imply that. What I am saying is that I haven't seen it yet...but also like I said before, that doesn't mean that I'm going to stop looking.
Prefetch
I haven't mentioned Prefetch artifacts in this blog for a while, as I really haven't had any reason to do so. However, I recently ran across Luis Rocha's Prefetch Artifacts post over on the CountUponSecurity blog, and I found it to be a pretty valuable reference.
Monday, June 06, 2016
Wait...There's More...
Tools
Mari posted to her blog again not long ago, this time sharing a description of a Mac artifact, as well as a Python script that implements her research and findings, and puts what she discussed in the hands of anyone using it.
Yes, Mari talks about a Mac artifact, and this is a Windows-based blog...but the point is that Mari is one of the very few members of the DFIR community who does something like this; identifies an artifact, provides (or links to) a clear description of that artifact and how it can be used during an examination, and then provides an easy-to-use tool that puts that capability in the hands of every analyst. While Mari shared that she based the script off of something someone else shared, she found value in what she read and then extended the research by producing a script.
Speaking of tools, Pasquale recently posted to the SANS ISC Handler's Blog regarding something they'd seen in the Registry; it's a pretty fascinating read.
Report Writing
I recently ran across James' blog post on writing reports...it's always interesting to hear others thoughts on this particular aspect of the industry. Like everyone else who attended public school in the US, I never much liked writing...never really got into it. But then, much like the justifications we try to use with math ("I'll never use this..."), I found that I ended up using it all the time, particularly after I got out of college. In the military, I wrote JAGMAN investigations, fitness reports (I still have copies of every fitrep I wrote), and a master's thesis.
Writing is such an important aspect of what we do that I included a chapter on the topic in Windows Forensic Analysis 4/e; Mari included a mention of the report writing chapter in her review of the book. After all, you can be the smartest, best analyst to ever walk the halls of #DFIR but if you can't share your findings with other analysts, or (more importantly) with your clients, what's your real value?
As James mentioned in his blog post, we write reports in order to communicate our findings. That's exactly why I described the process that I did in the book, in order to make it easier for folks to write clear, concise reports. I think that one of the biggest impediments to report writing right now is social media...those who should be writing reports are too impatient to do so because they're minds are geared to immediate gratification of clicking "Like" or retweeting a link. We spend so much time during the day feeling as if we've contributed something because we've forwarded an email, clicked "Like" on something, or retweeted it that our ability to actually communicate with others has suffered. We may even get frustrated with others who don't "get it", without realizing that by forcing ourselves into a limitation of 140 characters, we've prevented ourselves from communicating clearly.
Think about it. Which would you rather do? Document your findings in a clear concise report to a client, or simply tweet, "U R p0wned", and know that they read it when they click "Like"?
Look, I get that writing is hard, and most folks simply do not like to do it. It usually takes longer that we thought, or longer than we think it needs to, and it's not the fun, sexy part of DFIR. Agreed. However, it is essential. When we write the report, we build a picture of what we did and what we found, with the thought process being to illustrate to the client that we took an extremely comprehensive approach to our analysis and did everything that we could have done to address their issue.
Remember that ultimately, the picture that we paint for the client will be used to as the basis for making critical business decisions. Yes, you're right...we're not always going to see that. More often than not, once we send in our report to a client, that's it...that's the final contact we have with them. But regardless of what actually happens, we have to write the report from the point of view that someone is going to use our findings and our words as the basis for a critical business decision.
Another aspect of report writing that James brought up is documenting what we did and found, for our own consumption later. How many times have we seen something during an examination, and thought, "oh, wait...this is familiar?" How many times have we been at a conference and heard someone mention something that rang a bell with us? Documentation is the first step to developing single data points into indicators and threat intelligence that we use in future analysis.
WRF 2e Reviews
Speaking of books, it looks like Brett's written a review of Windows Registry Forensics 2/e up on Amazon. Thanks, Brett, for taking the time to put your thoughts down...I greatly appreciate it.
Sunday, June 05, 2016
Updates
RegRipper Plugins
I recently created a new RegRipper plugin named lastloggedon.pl, which accesses the Authentication\LogonUI key in the Software hive and extracts the LastLoggedOnUser and LastLoggedOnSAMUser values.
I wrote this one as a result of research I'd conducted based on a question a friend had asked me, specifically regarding the LastUserUsername value beneath the WinLogon key. As it turned out, I wasn't able to locate any information about this value, nor was I able to get any additional context, such as the version of Windows on which this value might be found, etc. I found one reference that came close to the value name, but nothing much beyond that.
Keep in mind that this plugin will simply get the two listed values. In order to determine users that had logged in previously, you should consider running this plugin against the Software hives found in the RegBack folder, as well as within VSCs, and those extracted from memory dumps or hibernation files.
Another means of determining previously logged in users is to move out of the Registry and parse Windows Event Log records. However, you can still use information within available Registry hives by mapping user activity (UserAssist, RecentDocs, shellbags, etc.) in a timeline.
Note that in order to retrieve values beneath the WinLogon key, you can simply use the winlogon.pl plugin.
AmCache.hve
Eric Zimmerman recently conducted a SANS webcast, during which he discussed the AmCache.hve file, a file on Windows systems that replaces/supersedes the Recentfilecache.bcf file, and the contents of which are formatted in the same manner as Registry hive files (the AmCache.hve file is NOT part of the Registry).
I enjoyed the webcast, as it was very informative. However, I have to say that I haven't had a great deal of luck with the information available in the file, particularly when pivoting off of ShimCache data during an exam. For example, while analyzing one image, I extracted the below two entries from the ShimCache data, both of which had the "Executed" flag set:
C:\Users\user\AppData\Local\Temp\Rar$EXa0.965\HandyDave.exe
C:\Users\user\AppData\Local\Temp\110327027.t.exe
Parsing the AmCache.hve file from the same system, I found two entries for "HandyDave.exe", neither of which was in the same path as what was seen in the ShimCache. I found NO references to the second ShimCache entry in the AmCache.hve file.
How did I parse the AmCache.hve file, you ask? I used the RegRipper amcache.pl plugin. While AmCache.hve is NOT a "Registry file" (that is, it's not part of the Registry), the file format is identical to that of Registry hive files and as such, viewing and parsing tools used on Registry hive files will work equally well on this file.
I found a lot of what Eric said in the webcast to be very informative and useful. Just because I've struck out on a handful of exams so far doesn't mean I'm going to stop including parsing the AmCache.hve file for indications of malicious activity. All I'm saying is that while conducting analysis of systems known to have been infected with something malicious, and on which an AmCache.hve file has been found, I have yet to find an instance where the malicious executable appears listed in the AmCache.hve file.
AppCompatCache
Speaking of Eric and his BinForay site, I've also been taking a look at what he shared with his recent AppCompatCacheParser post. I have taken some steps to address some of the issues with the shimcache.pl plugin that Eric described and have included an updated script in the RegRipper repository. There's still one issue I'm tracking down.
I also wanted to address a couple of comments that were made...in his post, Eric documented some tool testing he'd conducted, and shared the following:
appcompatcache.pl extracted 79 rows of data and in reviewing the data it looks like it picked up the entries missed by the Mandiant script from ControlSet01 but did not include any entries from ControlSet02:
That's due to the design...from the very beginning, all of the RR plugins that check values in the System have first determined which ControlSet was marked "current", and then retrieved data from that ControlSet, and just that ControlSet. Here's one example, from 2009, where that was stated right here in this blog.
Eric had also said:
In my testing, entries were found in one ControlSet that were not present in the other ControlSet.
I've also found this, as well. However, about as often, I've seen where both ControlSets have contained identical information, which was further supported by the fact that the keys containing the data had the same LastWrite times (as evidenced by examination, as well as inclusion in a timeline).
Addendum: A short note to add after publishing this post earlier this morning; I believe I may have figured out the issue with the appcompatcache.pl and shimcache.pl plugins not displaying all of the entries, as Eric described in his post. In short, it is most likely due to the use of a Perl hash, with the file name as the key. What happens is that the manner in which I had implemented the hash has the effect of de-duplicating the entries prior to parsing the hash for display.
Addendum #2: Okay, so it turns out I was right about the above issue...thanks to Eric for taking the time to identify the issue and point it out. I've not only updated the appcompatcache.pl, appcompatcache_tln.pl, and shimcache.pl plugins, I've also created a shimcache_tln.pl plugin, as well. I hope that someone finds them useful.
Subscribe to:
Posts (Atom)