Friday, July 28, 2023

Thoughts on Tool Features, pt II

My previous post on this topic addressed an apparent dichotomy (admittedly, based on a limited aperture) of thought between vendors and users when it comes to features being added to commercial forensic suites. This was the result of a road I'd started down a while back, trying to see if there was any value proposition to RegRipper at all (turns out, no, there isn't), and was simply the most recent pit stop along that road.

From my previous post, there seem to be two thoughts on the matter, or maybe it's more correct to say that only two basic positions or perspectives were shared. One is from vendors, some who rely on users to express the need for features; as such, vendors are relying on users to drive their own investigations, requesting or expressing the need for features as they arise. I'm sure vendors have ways of prioritizing those requests/needs, based on limited/available resources.

The other perspective is from users of those forensic tools; the views expressed are that if a vendor finds or 'sees' a cool feature, it should simply be added to the tool or framework, regardless of whether anyone actually wants it or not. To me, this seems to be users relying on vendors to drive investigations.

While I tend to agree more with the vendor perspective, as a user of forensic tools (albeit not commercial products), it seems that I have a different perspective from most users. There have been a few times in my career where I've had to deal with the issue of tool features; some examples follow:

CCN Searches
Circa 2009-ish (give or take), Chris Pogue and I were working a PCI forensic investigation, and found that while Discover and JCB cards had reportedly been processed by the merchant, none were appearing in our searches. As our team had recently grown, we had settled on EnCase (then owned by Guidance Software) as the tool used for all of the PCI-specific searches (CCNs, hashes, file names, etc.); this tool was commonly understood, and we wanted accuracy and consistency above all else.

We began digging into the issue, even going to the brands and getting test data. We kept reducing the scope of our testing, even to the point of, "here's a file with 3 Discover CCNs in it and nothing else...find all Discover CCNs", and each time, got no hits on either Discover or JCB card numbers. We determined that the IsValidCreditCard() built-in function, which was a closed-source "black box" for us, did not consider either brand of card number valid. We needed this capability now, and we were getting nowhere with the vendor, so we reached out to someone who was known for their EnScripting ability and asked for help. We ultimately ended up with a new function, one that included 7 Regexs, that we used to overload the built-in function. Borrowing a trick I learned from one my professors during my undergrad studies, Chris and I wrote up a quick email to everyone, stating, "copy this file to this location within the EnCase installation, etc.", and got everyone up and running at a consistent level pretty quickly. Yes, the process for searching for CCNs was a tad slower, but it was more accurate now, it was consistent across the team, and Chris and I could easily help troubleshoot any issues folks had in running the new function. After all, the only thing that could really go wrong at that point was that the file we sent was copied to the wrong location.

This all boiled down to the fact that we recognized that the tool we were using did not have the functionality we needed, even though, across the industry, everyone assumed that it did. We knew what we needed, we knew we needed it immediately, and we knew that we needed to ensure accuracy and consistency across the team. To do so, we sought help where we felt we needed it, and were more than willing to accept, "yeah, okay, we missed that..." along the way, in order to get to our goal. 

Carving Records
In 2012, I attended the DC3 conference in Atlanta, and after spending several days there and returning home, I ran into a fellow attendee at the baggage claim for our flight. We knew of each other within the community, and I had no idea we'd been on the same flight. As we were waiting, we got to chatting, and they mentioned that they'd been "looking at" a system for about 3 months, and were stuck. I wanted to know more, and they said they were stuck trying to figure out how to recover cleared Event Logs. As soon as they said that, I said that I'd send them a tool I'd written as soon as I got home...which I did. It was late when I got home, so I kissed my wife, turned my computer on, and sent them the tool along with instructions, as promised.

In this case, someone working for the government had a situation, an investigation, where they were stalled "looking at" the image...for 3 months. Now, I have no doubt that that didn't amount to 8 hrs a day, 5 days a week, etc., but that it was more on-and-off over the span of 3 months. However, during that entire time, I had a tool that I'd developed that would have been perfect for the situation, one that I'd not only developed but used to great effect. In fact, the tool was originally written because an Event Log on an XP system had 2 more records within the logical .evt file than were reported by the API, which I'd been able to recover by basically writing a carver. As such, what would work on a logical .evt file would work equally well on unallocated space extracted from an image via blkls.

RegRipper
Something I really like about RegRipper that wasn't something I specifically thought of during the original design is how easily it can be updated (the same applies to Events Ripper). For example, not long ago, I was looking into nssm, the "non-sucking service manager", and ran across the usage page. This page describes a number of Registry values and keys that are used by nssm, as well as by tools like it, such as MS's svrany.exe (which nssm replaces). Both provide persistence and privilege escalation (Admin to LOCALSYSTEM) capabilities, and I knew that I'd never remember to specifically look for some of these keys and values...so I wrote a RegRipperPro plugin to do it for me; the output of a test is illustrated in the figure below.

Fig: Appenvironment.pl Plugin Output


So, as you're reading this, you're probably thinking to yourself, "...but I can't write my own plugin." I get it. Some folks don't bother thinking, "I can't...", and just do it, but I get it..Perl isn't in common usage any longer, and programming simply intimidates some folks. That's cool...it's fine. 

Because all you need to do is ask for help, and maybe provide some sample data to test against. I've consistently turned working plugins around in about an hour, when folks have asked (which hasn't been very often).

The plugin I wrote (output in the figure above) took me just a couple of hours in the evening...I had to stop working to make dinner, take the dog out, etc., but it was pretty straightforward to complete. Now, I don't have to specifically remember these values (and the included key) when conducting an investigation; it's trivial to run all available plugins against various hives, so even a year from now, if I never revisit the issue that led to the plugin again, I'll still have the "corporate knowledge" and the query will still be part of my process.

So, I have something of a different perspective regarding tool features and who drives an investigation. My perspective has always been that as the analyst/investigator, it was my job to drive the investigation. Now, that doesn't prevent me from asking for assistance, or seeking someone else's perspective, but ultimately, the tools I use and the functionality I need are up to me, as an investigator, and I'm not going to structure my investigation around the functionality provided by a tool (or not, as the case may be).

Wednesday, July 26, 2023

Thoughts on Tool Features

Not long ago, some exchanges and conversations led me to do something I'd never done before...post a poll on LinkedIn. These conversations had to do with whether or not analysts and practitioners within the industry felt there was adequate value proposition to incorporate RegRipper in to a commercial forensic suite. No conditions, no specific goals or outcomes, just "is this something that makes sense?" As you can see from the poll, the responses (the few that there are) are pretty much 4:1 in favor of the idea.

I posted the poll because when I asked a vendor for their thoughts, the response was, "...none of our users have asked for it." Another vendor responded with:

...we need to focus on two things - what customers tell us they want (preferably things that are both powerful and unique), and what helps us in significant ways in our own casework.

There have been times we go pretty far out on a limb in terms of functionality we think people will want, and no one gives a shit. 

From a user perspective, some of the feedback from the poll, as well as from other conversations and exchanges, indicates that some users feel that vendors should take charge of providing "needed" functionality without being asked. 

This really seems like two diametrically opposed views on the subject, with the vendor side saying, "we rely on our users to tell us their needs", and the users saying, "we rely on our vendors to guide our investigations."

In 2020, I presented at OSDFCon on effectively using RegRipper. On pg 3 of the linked PDF, in the second slide, there are several thoughts I had regarding possible useful updates to RegRipper, including adding MITRE ATT&CK mapping, Analysis Tips, and reference URLs to the plugin output. I did not receive any feedback to this presentation, either during or following the presentation itself. No, "hey, this is a great idea!", and no, "OMG, this is the dumbest thing I've ever heard." However, I felt that these were things that I would find useful in the tool, and since other analysts didn't seem to be interested, I set about creating my own internal repo of RegRipper v4.0, or "Pro". This has become the tool I use, update, and continue to develop. In fact, earlier this year, I started in the first steps of creating plugins with JSON output, starting with the appcompatcache.pl plugin.

Back around 2007, I started developing what became RegRipper because none of the tools I had access to at the time, either commercial or free, provided the capability I needed for the work I was doing and the process I was developing. I opted to create a tool in the model of Nessus (i.e., plugins) so that I could easily update the tool without completely rewriting it. I developed the tool so that I could run individual plugins, or "profiles", which are designated groups of plugins that can be run in support of a playbook. I later added the ability to run all available plugins as it seemed to be how most folks were wanting to use the tool anyway.

The idea of "profiles", while I thought it would be an incredible capability, never caught on. You could run "profiles", or analysis playbooks based on file access, USB device usage, etc. I know that there are commercial tools out there that have these capabilities, but what RegRipper provided me was the ability not only to pick and choose, but to also update the tool with new plugins, new capabilities and functionality, with minimal turn-around time. I've had a few instances over the years where folks have reached out and asked for assistance, provided test data, and I've been able to turn around a working plugin in under an hour.

This is what I wanted for the community...for folks using the tool to find something they hadn't seen before, something new, and add to the tool. Unfortunately, that really never caught on, and to some extent, now I know why.

The question becomes, where do you stand? Do you think that vendors providing commercial forensic suites should drive investigations based on the features they provide, or should analysts and investigators be the ones who drive their investigations, and look for the right tool, or correct too usage?

Monday, July 24, 2023

The Next Step: VHD Files and Metadata

Keeping with the theme from my previous blog post of building on what others have done and written about, and of assembling the pieces that are already available to build on a foundation built by others, I found something interesting that seems like a great "next step".

Anyone who's followed this blog for any length of time knows that I'm a huge fan of metadata, and that anytime a threat actor sends you metadata from their endpoint or environment, it's basically free money. For example, my posts on LNK metadata extraction and what can be derived from analysis of this data go back quite a ways. Another great example of the use of LNK metadata to further investigations comes from Mandiant, in this Cozy Bear blog post from Nov, 2018 (see fig. 5 and 6).

Tony Lambert recently shared a blog post where he dug deep into getting intel from VHD file metadata, and then digging in even further to get intel from metadata within the files found within the VHD file, in this case, an LNK file. In his blog post, Troy used EXIFTOOL to extract metadata from both the VHD file and the LNK file.

I used my own toolset and as with EXIFTOOL, found that the LNK file had no available "machine ID" or NetBIOS system name for the host on which it was built; this is one of the elements of an LNK file, based on the documented structure format. However, this may not be unusual or unexpected, because the time stamps embedded in the shell item ID list elements were zeroed out, as illustrated in figure 1.

Fig. 1: Shell Item ID List Time Stamps


If you took a close look at the Mandiant blog post mentioned above, you'd see that the time stamps from the shell item ID list elements were what the analysts used to develop intrustion/threat intel, based on how the time stamps changed between the 2016 and 2018 campaigns. Zero'ing these values out is not difficult (I've done it before), and may actually be scripted, or simply added to the LNK builder.

While the lack of time stamps doesn't give us anything to pivot on or track, there is something else embedded within the available PropertyStoreDataBlock within the LNK file; specifically, a SID, as illustrated in figure 2.

Fig. 2: SID embedded in LNK 


Using this SID, a Yara rule can be used to perform a VirusTotal retro-hunt for similar LNK files, or to scan across local malware repositories. For example, from this LNK file, we can see that it was built on a system using a built-in Administrator account (RID: 500). 

From an intrusion intel perspective, it's pretty clear that if a threat actor sends files to a target, they're very likely sharing a wealth of information about their development environment. When it comes to LNK files, even those embedded in disk image (ISO, VHD) files, a great deal of information about the development environment may be shared (as described by the folks at JPCERT in 2016).

Issues With VHD Files
Two of the issues with image files (ISO, IMG, VHD[X]) is that users can automatically mount them via a double-click, and that ISO files in particular did not not propagate mark-of-the-web (MotW), a security "setting" available on files downloaded from the Internet. The MotW issue with ISO files in particular was addressed in a Nov 2022 security update. If users have no legitimate business reason to automatically mount disk image files via double-clicking them, Huntress has a blog post that addresses disabling this capability, while still permitting programmatic access to the files, such as mounting a VHD or VHDX file via the Disk Manager. Disabling the ability for users to double-click and automatically mount these files as accessible file systems has been available for some time but the Huntress blog makes it a simple matter of copying and pasting the PowerShell code to change the setting.

Shoutz to Tony, not only for his work, but for sharing it with us all! We're all the better for it when we take the time to write about our research or experiences, sharing them with others.

Additional Resources
VHDX metadata table entry 

Sunday, July 23, 2023

The Next Step

A lot of times, we'll run across something or read something really very profound and valuable, something that opens our eyes and makes us go, "oh, wow", and impacts us enough that it changes the way we do things. I can say that of a number of blogs posts and articles, by various authors, going back quite a few years. And then later, being able to add additional information to the original findings, information that may not have been recognized or available at the time, can really aid in our investigations.

A while back, Krz shared this blog post, detailing how default settings for Scheduled Tasks include the "stop if the computer switches to battery power" setting by default, and the impact that setting can have on a forensic investigation. For example, PCI forensic investigations require the analyst to specifically address the "window of compromise", and malware that persists via a Scheduled Task will be impacted by whether or not the system in question was running on battery power or not. Krz's previous blog post addressed using the SRUM database to determine the battery charge level, and in that post, Krz linked to a tool he'd written to extract and display that data.

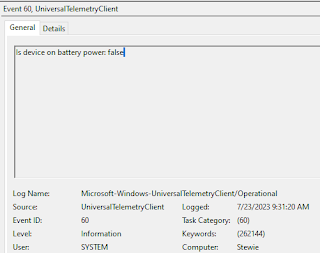
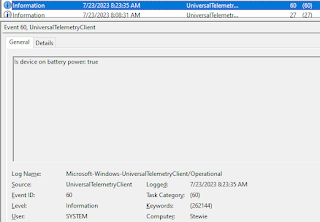
I ran across something recently that I wanted to use to build on Krz's excellent work; from the Microsoft-Windows-UniversalTelemetryClient%4Operational.evtx Event Log, we see a UniversalTelemetryClient/60 event record that lets us know if the system was on battery power or not, as illustrated in figure 1:

Fig 1: UniversalTelemetryClient/60 event, on batter power 


In this particular case, I took my laptop from my office to another room, so I could attach it to the TV via an HDMI cable and watch our church service remotely. When service was complete, and I reconnected the laptop to the power cord in my office, I saw the UniversalTelemetryClient/60 record illustrated in figure 2.


Fig. 2: UniversalTelemetryClient/60 event, off batter power


From the same Windows Event Log file, UniversalTelemetryClient/55 records will let us know if the system had access to the Internet or not, further aiding us in our investigation. This information (system is on or off battery, on or off the Internet) can be extremely valuable during an investigation, particularly when incorporated into a timeline. If a system has malware that persists via a Scheduled Task using default settings, and the system if on battery power when the task was scheduled to run, then it will not run. It may also be helpful to understand when the system did and did not have an Internet connection.

Friday, July 14, 2023

Events Ripper Update

Something I really, really like about tools like RegRipper and Events Ripper is that when I see something in the data during an investigation, I can explore whether it makes sense to pull that out and make it visible to the investigator, and if so, figure out how it makes sense to do so. Because of how these tools are set up, the turn around for something new is pretty quick, and the retention (and sharing) of corporate knowledge is pretty freakin' cool!

This time, I updated the logins.pl plugin, so that it collects and displays some additional data points beyond the 'current' version; specifically, usernames and SIDs for type 3 and type 10 logins, as well as source system names (if not "-" in the event record), correlated to source IP address, for type 3 and type 10 logins.

During a recent incident we were digging into a bit further, we were seeing some odd source system names, ones we'd seen previously, on other incidents for other customers. Now, this isn't stating definitively that it's the same source system, of course, but it is an interesting data point worth tracking...so why not extract that information and make it easy for an analyst to see. We were also seeing repeated type 3 logins for a source system named "nmap", and I wanted to see the logins and source IP addresses that may have had the same source system name. Interestingly, we also saw some additional anomalies, but the point is that this information is easy to see now.

With the usernames, in one instance, we were seeing repeated type 3 logins for the "Guest" account; including the SID alongside the username for the type 3 (and type 10) logins provides insight into possibly compromised credentials. In the case we were looking at, the RID for the account was 501, which tells us that someone had enabled the Guest account, something that serves as an interesting data point for the incident.

I'd love to provide some sample output but most of the CTF data I have access to doesn't include a great deal of terribly interesting data points. 

Saturday, July 08, 2023

Hiding In The Windows Event Log

In May 2022, Kaspersky published a write-up on a newly-discovered campaign where malware authors wrote shellcode to the Windows Event Log. This was pretty interesting, and just about 4 months later, Tim Fowler published this blog post over at BlackHillsInfoSec, digging into this a bit deeper and offering several variations of the technique up to red teamers.

Now, I found this technique interesting, not because it's not really something I'd seen before, but because of how Windows Event Logs, and just "Event Logs" prior to Vista, have been used by DFIR analysts. Back in the days of WinXP and Windows 2000/2003, there were The Big Three...Security, System, and Application Event Logs. With the advent of Vista, and then Windows 7, the numbers of Windows Event Logs available to analysts exploded; on my Windows 10 system, a 'dir' of the winevt\logs folder reveals 400 files with the ".evtx" extension. However, not all logs are populated, or even enabled. 

However, this doesn't mean that these logs are used during analysis; in fact, much like the Registry, the Windows Event Logs are largely misunderstood by a great many analysts, to the point where I've seen log collection processes that are still restricted to just the Security, System, and Application Event Logs. Further, there seems to be a great deal of Windows forensic analysis training that persists in identifying Windows Event Log records solely by their event ID, even when it's been stated and shown that event IDs are not unique. For example, we often refer to "event ID 4624" when identifying successful login events, but when the event source is "EventSystem", that event ID has an entirely different meaning and significance. And there's nothing the prevents someone from creating an application that writes it's logs to a current or it's own Windows Event Log, using the same event ID. In just the past year, I've seen several tools used by threat actors that create Windows Event Log records, two of which use event ID 0 (zero) for everything, literally every record written, regardless of the message, is event ID 0.

In short, using a Windows Event Log file as a persistent repository is a great idea because responders and analysts aren't likely to look there, nor consider it as a source. I found the use of the "Key Management Service" Event Log pretty interesting, because while it's enabled on the systems I have access to, it's not populated on any of them. 

So, I went ahead and tried a variation of one of Tim's commands, as illustrated in figure 1.

Fig. 1 - Powershell command 


The resulting WEVT record can be seen in figure 2.

Fig. 2 - Resulting Windows Event Log record


This is the first record written to that WEVT file on this system, and as you'd expect, the file last modification time reflects that. This illustrates why this particular Windows Event Log file serves as a pretty decent persistent repository. You could change the log file used, but you'd have to find one that either is extremely low volume, or enable one that is similarly low volume. A Windows Event Log that regularly has records written to it does not serve as a suitable persistence mechanism, unless you're able to increase the size of the file,

Tim goes on in his article to extend the technique beyond what Kaspersky discovered, and what this really demonstrates is that there's a great deal that can be done with a few simple (native) tools, some knowledge, and some imagination. And, what makes it "interesting" is that it relies on a data source not often leveraged or exploited by analysts.

Tools like Chainsaw and Events Ripper would not be effective for detecting the use of this technique, particularly if the Windows Event Log used for this technique was not included in the collection process. An Events Ripper plugin that listed all source/ID pairs and their frequency might provide a pivot point for the analyst, but a timeline of system activity would certainly show any suspicious records, again, as long as the impacted WEVTX log is included in the collection process.

This StackOverflow question resulted in several ways to create Windows Event Log records using native methods such as eventcreate.exe, Powershell, etc.  Note that using eventcreate.exe is restricted to just the Application Event Log, but the availability of anything written to this (or another) Windows Event Log can be adjusted by the file size and retention settings.

Wednesday, June 28, 2023

Interview Questions

There's been a lot of ink put toward resume recommendations and preparing for interviews over the years, and I feel like there's been even more lately, given the number of folks looking to transition to one of the cybersecurity fields, as well as tech layoffs we've seen since last year.

One of the topics I don't really see being addressed is questions you, the interviewee, can ask of the interviewer when it's your turn. As an interviewee, you're probably preparing yourself for the technical questions you're likely to face, but there are other aspects to the role.

I was once in a role where an organization was trying to start a consulting arm, so they hired a manager and one or two technical folks in each of two offices. Not long after starting, I found that the analyst in the other office was going to conduct a pen test for a customer; that analyst had previously worked at ISS, where they'd installed the RealSecure IDS product for that customer. I won't bore you with the drama, but suffice to say that I was able to get a copy of the "pen test" report; the engagement amounted to nothing more than running ISS's Internet Scanner product against the customer systems. As our team hadn't generated revenue yet, we didn't have any licenses for ISS's, nor anyone else's products. As such, the license used to run Internet Scanner was hacked, which the RealSecure product could detect. I gave notice after I found out that management had no intention of addressing the issue.

So, a question to ask interviewers at both the technical and management level is, you find out that tools were used on an engagement without valid licenses...what do you do?

Other questions you could ask include:

You find out that tools used on an engagement were run outside the bounds of the license agreement; what do you do?

You find out that a DFIR report or SOC ticket (depending upon the role you're interviewing for) submitted to a customer is grossly incorrect; not just "it could be misinterpreted" but what was reported to the customer was just flat out wrong. What do you do?

As the interviewee, the answers to these questions will give you insight into what to expect at the organization, should you accept an offer. 

However, interviewers can also ask these questions, and gain insights themselves.

And yes, these questions are based on my experiences in the field.

Monday, June 26, 2023

Validation - This Time, Tool Validation

I've posted previously on validation, and more recently, on validation of findings. In my recent series of posts, I specifically avoided the top of tool validation, because while tool validation predicates the validation of findings, and there is some overlap, I thought it was important separate the two so that the discussion didn't go astray. 

Well, now the topic of tool validation within DFIR has popped up again, so maybe it's time to address it yet again.

So, early on in my involvement in the industry, yes, running two or more tools against a data source was considered by some to be a means of tool validation. However, over time and as experience and knowledge grew, the fallacy of this approach became more and more apparent. 

When I first left active duty, one of my first roles in the private sector was performing vulnerability assessments. For the technical aspect (we did interviews and reviewed processes, as well) we used ISS's Internet Scanner, which was pretty popular at the time. When I started, my boss, a retired Army Colonel, told me that it would take me "about 2 to 3 years of running the tool to really understand it." Well, within 6 months, I was already seeing the need to improve upon the tool and started writing an in-house scanner that was a vast improvement over the commercial tool.

The reason for this was that we'd started running into questions about how the tool did it's "thing". In short, it would connect to a system and run a query, process the results, and present a "decision" or finding. We started to see disparities between the tool findings and what was actually on the system, and as we began to investigate, we were unable to get any information regarding how the tool was making its decisions...we couldn't see in to the "black box".

For example, we scanned part of an infrastructure, and the tool reported that 21 systems had AutoAdminLogon set. We also scanned this infrastructure with the tool were developing, and found that one system had AutoAdminLogon set; the other 20 systems had the AutoAdminLogon value, but it was set to "0", and the admin password was not present in the Registry (in plain text). So, technically, AutoAdminLogon was not set on all 21 systems, and the customer knew it. Had we delivered the report based solely on the tool output, we would've had a lot of 'splainin' to do. 

When I was working for a consulting company and waiting for a gubmint clearance to come through, I heard a senior analyst tell one of the junior folks that Nessus would determine the version of Windows it was running against by firing of nmap-like scans, and associating the responses it received to the drivers installed in various versions of Windows. I thought this was fascinating and wanted to learn more about it, so I downloaded Nessus and started opening and reading the plugins. It turned out that Nessus determined the version of Windows via a Registry query, which meant that if Nessus was run without admin credentials, it wasn't going to determine the version. 

While I was part of the IBM ISS X-Force ERS team, and we were conducting PCI forensic response, Chris and I found that our process for scanning for credit card numbers had a significant flaw. We were using EnCase at the time, which used a built-in function named "IsValidCreditCard()". We had a case where JCB and Discover credit cards had reportedly been used, but we weren't seeing any in the output of our scanning process. So, we obtained test data from the brands, and ran our scan process across just that data, and still got no results. It turned out that even with track 1 and track 2 data, the IsValidCreditCard() function did not determine JCB and Discover cards to be "valid". So, we worked with someone to create a replacement function to override the built-in one; our new function had 7 regular expressions, and even though it was slower than the built-in function, it was far more accurate.

Finally, in the first half of 2020, right as the pandemic kicked off, I was working with a DFIR consulting team that used a series of open source tools to collect, parse, and present DFIR data to analysts. MS had published a blog post on human-operated ransomware, and identified a series of attacks where WMI was used for persistence; however, when the team encountered such attacks, they were unable to determine definitively if WMI was used for persistence, as the necessary data source had been collected, but the open source middleware that parsed the data did not include a module for parsing that particular data source. As such, relying on the output of the tool left gaps that weren't recognized.

So, what?
So, what's the point of reliving history? The point is that tool validation is very often not about running two (or more) different tools and seeing which presents "correct" results. After all, different tools may use the same API or the same process under the hood, so what's the difference? Running two different tools that do the same thing isn't running two different tools, and it's not tool validation. This is particularly true if you do not control the original data source, which is how most DFIR analysis works. 

As alluded to in the examples above, tool validation needs to start with the data source, not the tool. What data source are you working with? A database? Great, which "style"? mySQL? SQLite? EDB? How does the tool you're using work? Is it closed source, or open source? If it's open source, and written in Python or Perl or some other interpreted language, what are the versions of the libraries on which the tool is based? I've seen cases where a script will not throw an error, but did present different data based on the library used.

This is also why I strongly recommend that analysts validate their findings. Very often there are direct or indirect artifacts in other data sources that are part of an artifact constellation that serves to validate a finding; if you run your tool and see something "missing" or added, you can then look to the overall constellation and circumstances to determine why that might be. 

Saturday, June 24, 2023

DFIR Core Principles

My copy of "Forensic Discovery"
There are a lot of folks new to the cybersecurity industry, and in particular DFIR, and a lot of folks
considering getting into the field. As such, I thought it might be useful to share my view of the core, foundational principles of DFIR, those basic principles I return to again and again during investigations, as well as over the course of time. For me, these principles were developed initially through a process of self-education, reading all I could from those who really stood out in in the industry. For example, consider the figure to the right...this is what pages 4 and 5 of  my copy of Forensic Discovery by Farmer and Venema look like. The rest of the pages aren't much different. I also have a copy of Eoghan Casey's Handbook of Digital Forensics and Investigations, which is in similar "condition", as are several other books, including my own.

The thing we have to remember about core principles is that they don't change over time; Forensic Discovery was published in 2005, and Casey's Handbook, 5 yrs later. But those principles haven't changed just because the Windows operating system has evolved, or new devices have been created. In fact, if you look at the index for Farmer and Venema's book, the word "Windows" never appears. My last book was published in 2018, and the first image covered in the book was Windows XP; however, neither of those facts invalidate the value of the book, as it addresses and presents the analytic process, which, at it's root, doesn't significantly change.

The principles I'm going to share here do not replace those items discussed through other media; not at all. In fact, these principles depend on and expand those topics presented in other books.

Principle 1
The first thing you have to understand about computer systems is that nothing happens on a computer system without something happening; that is, everything is the result of some action.

I know this sounds rudimentary, and I apologize if it sounds overly simplified, but over the course of my career (spanning more than 2 decades at this point) in various roles in DFIR, one of the biggest obstacles I've encountered when discussing a response with other analysts is that things don't just happen for no reason. Yes, it's entirely possible that any given, random bit on a hard drive may change state due to a fluctuation of some kind, but when it comes to a field in an MFT record (deleted vs in use file) or a Registry value changing state (1 to 0, or reverse), these things do not simply happen by themselves.

Let's say, for example, that a SOC analyst receives an alert that the "UseLogonCredential" value has been set to "1". This is a pretty good detection indicating that something bad has already happened, and that something bad is likely to happen in the very near future, as well. However, this does not just happen...someone needs to access the system (via keyboard or remotely) with the appropriate level of privileges, and then needs to run an application (RegEdit, reg.exe, another program that accesses the appropriate API functions...) in order to make the change.

Principle 2
Locard's Exchange Principle is one of Chris Pogue's favorites, to the point where he discusses it in his courses at OSU! This principle states that when two objects come into contact with each other, material is exchanged between them. This applies to the digital realm, as well; when two computers come into "contact", "material" or data regarding the connection and interaction is exchanged between them. Some of this data may be extremely transient, but due to advancements in computer use functionality, the fossilization of this data begins pretty quickly. That is to say that some of these artifacts are "stored" or logged, and those log entries can exist for varying amounts of time. For example, a record written to the Security Event Log may be overwritten within a few days (or even hours, depending upon the audit configuration and activity on the endpoint), but records written to other Windows Event Logs may exist for years without the risk of being overwritten. Evidence of activity may be written to the Registry, where it may exist until explicitly removed.

But the point of this principle is that something, some artifact of activity as a user or threat actor interacts with an endpoint will be created, and may continue to exist for a significant period of time.

Principle 3
This brings us to the third principle, direct vs indirect artifacts. This is something of a reiteration of section 1.7 (Archeology vs Geology) of Farmer & Venema's book; table 1.3 at the bottom of pg 13 essentially says that same thing. However, this principle needs to be extended to address more modern operating systems and applications; that is, when something happens on an endpoint...when a program is executed, or when a user or threat actor interacts with the endpoint in some way, there are artifacts that are created as a direct result of that interaction. For example, a threat actor my copy a file over to the endpoint, writing it to the file system. Then they may execute that program, redirecting the output to a file, again writing to the file system.

Think of this as a video camera pointed directly at the "scene of the crime", recording direct interactions between the threat actor and the target victim.

There are also "indirect" artifacts, which are those artifacts created as a result of the program or threat actor interacting with the ecosystem or "environment". 

A great way to think of indirect artifacts is having video cameras near the scene of a crime, but not pointed directly at the scene itself. There may be a video camera across the street or around the corner, pointed in a different direction, but it captures video of the threat actor arriving in a car, and then leaving several minutes later. You may notice that the back seat of the car seems to be fuller than when it arrived, or the end of the car near the trunk (or "boot") may be lower to the ground, but you do not see exactly which actions occurred that resulted in these apparent changes.

A great thing about both direct and indirect artifacts is "fossilization", something mentioned earlier, and to be honest, stolen borrowed from Farmer and Venema. Everything that happens on an endpoint is the result of something happening, and in a great many cases, these artifacts are extremely transient. Simply put, depending upon where those artifacts exist in the order of volatility, they may only exist for a very short period of time. In their book, Farmer and Venema discussed "fossilization", specifically in the context of deleted files with *nix-based file systems. Operating systems have grown and evolved since the book was published, and a great deal of usability features have been added to operating systems and applications, significantly extending this fossilization. As such, while direct artifacts of user or threat actor interaction with an endpoint may not persist for long, fossilization may lead to indirect artifacts existing for days, months, or even years.

For example, let's say a threat actor connects to an endpoint; at that point, there is likely some process in memory, which may not exist for long. That process memory will be allocated, used, and then freed for later use, and given how "noisy" Windows systems are, even when apparently idle, that memory may be reused quickly. However, direct artifacts from the connection will very often be logged, depending upon the means and type of access, the audit and logging configuration of the endpoint, etc. If this process results in the threat actor interacting with the endpoint in some way, direct and indirect artifacts will be logged or "fossilized" on the endpoint, and depending upon the configuration, use, and subsequent interaction with the endpoint, those fossilized artifacts may exist for an extended period of time, even years.

Monday, June 19, 2023

The Need for Innovation in DFIR

Barely a week goes by and we see another yet post on social media that discusses knowledge sharing or "training" in cybersecurity, and in particular, DFIR and Windows forensic analysis. However, many times, these posts aren't "new", per se, but instead share information that is dated. 

Now, there's nothing wrong with what many perceive to be "old" or "dated" information because the simple fact is that core principles simply don't change over time. However, there are more tactical elements of "analysis" (really, data parsing and presentation for analysis) that may, in fact, change over time. This is particularly true for Windows systems, particularly as it applies to the various builds available for Windows 10; analysts saw the creation or availability of a particular artifact (i.e., the "BAM" Registry key) in one build, only to no longer see it populated in another build.

Something else we see is an incorrect or incomplete use of terminology, which in some cases seems to be almost willful. We see this a lot when it comes to the Windows Registry, but that's really fodder for it's own post/article. However, there are posts like this one, that purports to share "important Windows directories", and the first six items listed are files. Further, items 4 through 6 are not "logs". Over the past several months, I've seen that particular list posted multiple times in LinkedIn, and just last week, it somehow made its way into my Twitter feed, unfortunately.

Something else we see quite often references the Windows Event Logs, and claims to share important records, but only presents those records based on event IDs. The issue here is that event IDs are not unique. While most of us are familiar with event ID 4624, it means one thing when the event source is "Microsoft-Windows-Security-Auditing", and something else entirely when the event source is "Microsoft-Windows-EventSystem".

So What?
Okay, so what? Who cares? We see this all the time, it's pretty common...no, I take that back, it's really common, everyone's doing it, so what?

Well, I think we can all agree that the bad guys are innovating day-in and day-out, and the only way the "blue" side is going to keep up or even get ahead is by innovating in our own way. As such, the first step is to move beyond the "...this is the way we've always done it..." approach, to use that as a stepping stone or launching point for implementing a new model for DFIR analysis, one that bakes the lessons of the last incident back into the process so that those lessons are applied to subsequent incidents/analysis. 

We see some application of an approach like this for the SOC with the development of SOAR capabilities, and while DFIR can be thought of as an additional tier of the SOC, or as a standalone service, this isn't something that has seen much in the way of development within DFIR. Many (albeit not all) DFIR shops follow the same basic model...collect data, assign it to an analyst to parse and provide their findings. Unfortunately, what we tend to see in consulting firms and mirrored by some in-house teams, is a 1:3 or even 1:4 ratio between analysts and licensed forensic suites, with each analyst following their own process. Many times, this process is not documented, and simply run from memory; add to that the disparity in knowledge and experience between analysts working in isolation, and you can see how this model is inefficient and error-prone. 

So, let's stop following the old way of doing things. Let's stop referring to Windows Event Log records solely by event ID. Let's stop viewing individual artifacts or data sources in isolation, and instead start correlating artifacts and events, looking at the side-by-side based on time stamps. If we then use a common set of tools, or a common framework for parsing and correlating data sources, we can then build on that process and begin decorating and enriching data, much like what I've been doing with Events Ripper (it's important to note that I'm not the only who can write Events Ripper plugins; so far, I'm just the only one who does).

This way, we can use automation to build on and share our own experiences, so that others may benefit from those experiences, without having to go through the investigative process themselves. This gets analysts to the point of actually conducting analysis sooner, so that there is more of an opportunity to discover new artifacts and associations, in a much more efficient manner.

Monday, June 05, 2023

Events Ripper Update

Yet again, recent incidents have led to Events Ripper being updated. This time, it's an updated plugin, and a new plugin.

appissue.pl - I updated this plugin based on Josh's finding and Tweet; I can't say that I've ever seen this event before, but when Josh mentioned it, I thought, hey, this is a great way to go about validating activity! Okay, so here's a batch file, and we see commands run via EDR telemetry...but do they succeed?? We may assume that they do, but it's a pretty straightforward process to validate these findings; in the incident that Josh reported, it turns out that the driver being loaded failed because it was blocked. Correlate that event with the other two events that Josh pointed out, and you've got pretty decent evidence indicating that while an infection was attempted and the driver was created within the file system, it's not loading. This gives us some headspace for our investigation, and provides evidence we can report to regulatory oversight bodies, etc.

sec5381.pl - I created this plugin as a result of analysis conducted during a recent investigation into the use of credential theft tools. We'd seen the use of a number of credential theft tools...lazagne, mimikatz, VNCPassView, PasswordFox64, etc. Some of these triggered alerts, so I started by creating a timeline from the EDR telemetry. As our telemetry does a great job of illustrating the process tree, I was able to tie all of these alerts, as well as other processes identified by analysts hunting for additional activity, to the original login session. As I began using the process creation time stamps to pivot into a timeline created from WEVTX data, I began to see several Microsoft-Windows-Security-Auditing/5381 records; in two instances, these events correlated to the use of WebBrowserPassView and IEPV

What's interesting about this event record is that it includes the logon ID; I ran the following commands:

type events.txt | find "<logonID>" > id_events.txt
parser -f id_events.txt > id_tln.txt

I now had a micro-timeline of just the events associated with the unique logon ID, so I could see the breadth of the activity (i.e., when it started, when it ended, what occurred during that time, etc.). Depending upon the audit configuration of the endpoint, there are a number of other event records that also contain the logon ID, and would be included in our micro-timeline. However, even without those, we can fill in "gaps" via other means, such as just looking at the span of time, from the "oldest" to the most recent event from our "logon ID" search.

By the way, this approach is nothing new. I've used this technique...used simple DOS commands...to navigate, pivot, and get a specific view into timelines for some time now. This is part of the reason why I persist in maintaining the intermediate file ("events.txt") in a flat text file; it's easy to parse and enumerate with simple commands (no SQL queries needed), it's easy to combine multiple timelines, and the files compress really well for storage and shipping. Because they're text-based, they also don't need any special tools to access; doing a search in Notepad++, for example, I can choose the "Count" option to see how many times the search term appears in the file, and I can search backward to find the earliest event associated with that term. 

Thursday, June 01, 2023

Events Ripper Update

Working a recent incident, I came across something very unusual. I started by going back into a previous investigation run against the endpoint that had been conducted a month ago, and extracting the WEVTX files collected as part of that investigation. So, the WEVTX files were retrieved from the endpoint on 30 Apr, and when I created the timeline, I found that the four most recent time segments were from 1 June 2024...that's right, 2024!

As I was using some of the indicators we already had (file and process names) to pivot into the timeline, I saw that I had Security Event Log records from 2020...now, that is weird! After all, it's not often that I see Security Event Log records going back a week or month, let alone 3 years!

Another indicator was the sessions.pl output from Events Ripper; I had logins lasting 26856 hours (1119 days), and others lasting -16931 hours (over 705 days). Given how the session span is calculated, I knew some was "off" in the Security (and very likely, other) Event Logs, particular the records associated with logon and logoff events. 

I knew something was up, but I also knew that finding the "what was up" was also based largely on my experience, and might not be something a new or more junior analyst would be familiar with. After all, if an analyst was to create a timeline (and I'm seeing everyday that's a pretty big "if"), and if they were pivoting off of known indicators to build context, then how likely would it be that they had the experience to know that something was amiss?

So, naturally, I wrote an Events Ripper plugin (timechange.pl) to pull Security-Auditing/4616 event records from the Security Event Log and display the available information in a nice table. The plugin collects all of these events, with the exception of sub-second time changes (which can be fairly common), and displays them in a table showing the user, the time changed from, the time changed to, and via which process. I wrote the plugin, and it produced an entry on the next investigation...not one that had much impact on what was going on, as the system clock was updated by a few minutes, but this simply shows me how the use of plugins like this can be very valuable for elevating interesting and important artifacts to the analyst for review without requiring that analyst to have extensive experience.

Friday, May 26, 2023

Events Ripper Updates

I updated an Events Ripper plugin recently, and added two new ones...I tend to do this when I see something new to that I don't have to remember to run a command, check a box on a checklist, or take some other step. If I have to do any of these, I'm not going to remember these steps, so instead, I just create a plugin, drop it into the "plugins" folder, and it gets run every time, for every investigation. What's really cool is that I can re-run Events Ripper after I add addition Windows Event Log files to the mix, or after creating a new plugin (or updating a current one); most often, it's just hitting the up-arrow while in the command prompt, and boom, it's done.

Here's a look at the updates:

bitsclient.pl - I added some filtering capabilities to this plugin, so that known-good URLs (MS, Google, Chrome, etc.) don't clutter the output with noise. There is a lot of legitimate use of BITS on a Windows system, so this log file is likely going to be full of things that aren't a concern for the analyst, and are simply noise, obscuring the signal. I'm sure I'll be updating this again as I see more things that need to be filtered out.

posh600.pl - I wanted a means for collecting PowerShell scripts from event ID 600 records in the Windows PowerShell Event Log, so I wrote this plugin. As with other plugins, this will provide pivot points into the timeline, helping to more easily elevate potentially malicious activity to the analyst, leveraging automation to facilitate analysis.

Similar to the bitsclient.pl plugin, I took steps to reduce the volume of information presented to the analyst. Specifically, I've seen on several investigations that there are a LOT of PowerShell scripts run as part of normal operations. So, while the plugin will collect all scripts, it only displays those that appear 5 or fewer times in log; that is, it shows those that appear least frequently.

Something I really like about this plugin is the use of data structures (via Perl) to manipulate the data, and how they lead to the data being presented. Anyone who's looked at the data in the Windows Powershell.evtx log file knows that for each script, there are something like 6 records, each with a lot of information that's not entirely useful to a DFIR or SOC analyst. Also, there are infrastructures that use a LOT of PowerShell for normal IT ops, so the question becomes, how do we reduce the data that the analyst needs to wade through, particularly those analysts that are less experienced? Well, the approach I took was to first collect unique instances of all of the scripts, along with the time at which they were seen. Then, the plugin only displays those that appeared 5 or fewer times in the log (this value is configurable by anyone using the plugin, just change the value of "$cap" on line 42). By displaying each script alongside the time stamp, it's easy for an analyst to quickly 'see' those scripts that were run least frequently, to 'see' what the scripts are doing, and to correlate data with other sources, validating their findings

So far, this technique has proven effective; during a recent investigation into two disparate endpoints that exhibited similar malicious activity, we were able to correlate the PowerShell scripts with RMM access logs to validate the specific RMM tool as the means of access. By viewing the scripts listed in reverse order (soonest first) based on time stamps, we were able to not only correlate the activity against the threat actor's batch file, with the logins, but also demonstrate that, on one endpoint, the batch file did not complete. That is, several lines from the batch file, evidenced as PowerShell scripts extracted from the WEVTX log file did not appear in the data on one endpoint. This demonstrated that the attack did not complete, which is why we detected the first endpoint our telemetry, but not the second one (because it didn't succeed).

As a side note, on the first endpoint, the timeline demonstrated that the coin miner crashed not long after it was started. Interestingly enough, that's what led to the next plugin (below) being created. ;-)

For those who are interested and want to do their own testing, line 42 of the plugin (open it in Notepad++, it won't bite...) lists the value "$cap", which is set to "5". Change that value, and re-run the plugin against your events file; do this as often as you like.

I will say that I'm particularly proud/fond of this plugin because of the use of data structures; Perl "hash of hashes" to get a list of unique scripts, transitioning to a Perl "hash of arrays" to facilitate least frequency of occurrence analysis and display to the analyst. Not bad for someone who has no formal training in computer science or data structures! It reminds me the time I heard Martin Roesch, the creator of the snort IDS, talk about how he failed his CS data structures course!

nssm.pl - apparently, nssm.exe logs to the Application Event Log, which helps to identify activity and correlate Window Event Log records with EDR telemetry. Now, a review of EDR telemetry indicates that nssm.exe has legitimate usage, and is apparently included in a number of packages, so look at the output of the plugin as potential pivot points, not that it's bad just because it's there.

And, hey, I'm not the only one who finds value in Events Ripper...Dray used it recently, and I didn't even have to pay him (this time)!!

Tuesday, May 16, 2023

Composite Objects and Constellations

Okay, to start off, if you haven't seen Joe Slowik's RSA 2022 presentation, you should stop now and go watch it. Joe does a great job of explaining and demonstrating why IOCs are truly composite objects, that there's much more to an IP address than just it being...well...an IP address. When we start thinking in these terms, in terms of context, the IOCs we see and share can become much more actionable. 

Why does any of this matter? Once, in a DFIR consulting firm far, far away, our team was working PCI forensics investigations, and Visa was sending us monthly lists of IOCs that we had search for during every case. We'd get three lists...one of file names, one of file paths, and one of hashes. There was no correlation between the various lists, nothing like, "...a file with this name and this hash existing in this folder...". Not at all. Just three lists, without context. Not entirely helpful for us, and any hits we found could be similarly lacking in any meaning or context..."hey, yeah, we found that this folder existed on one system...", but nothing beyond that was asked for, nor required. The point is that an IOC is often more than just what we see at face value...a file has a hash, a time frame that it existed on the system (or was seen on other systems), functionality associated with the file (if it's an executable file), etc. Similarly, an IP address is more than just four dot-separated octets...there's the time frame it was associated with an endpoint, the context with respect to how it was associated with the endpoint (was it the source IP for a login...what type...or lateral movement, was it a C2 address, was it the source of an HTTP request), etc.

Symantec recently posted an article regarding a group identified as "LanceFly", and their use of the Merdoor backdoor. In the article, table 1 references different legitimate applications used in DLL sideloading to load the backdoor; while the application names are listed, there are a couple of items that might be important missing. For example, what folders were used? For each of the legitimate applications used, were they or other products from the vendor used in the environment (i.e., what is the prior prevalence)? Further, there's no mention of persistence, nor how the legitimate application is launched in order to load the Merdoor backdoor. Prior to table 1, the article states that the backdoor itself persists as a Windows service, but there's no mention of how, once the legit application and the sideloaded DLL are place on the system, how the legit app is launched.

This is something I've wondered when I've seen previous cases involving DLL sideloading...specifically, how did the threat actor decide which legitimate application to use? I've seen cases, going back to 2013, where legit apps from McAfee, Kaspersky, and Symantec were used by threat actors to sideload their malicious DLLs, but when I asked the analyst working that case if the customer used that application within their environment, most often they had no idea.

Why does this matter? If the application used is new to the environment, and the EDR tool used within the infrastructure includes the capability, then you can alert on new applications, those that have never been 'seen' in the environment. Does your organization rely on Windows Defender? Okay, so if you see a Symantec or Kaspersky application for the first time...or rather, your EDR 'sees' it...then this might be something to alert on.

Viewing indicators as composite objects, and as part of constellations, allows us to look to those indicators as something a bit more actionable than just an IP address or a file name/hash. Viewing indicators as composite objects helps add context to what we're seeing, as well as better communicate that context to others. Viewing indicators as one element in a constellation allows us to validate what we're seeing. 

The Windows Registry

When it comes to analyzing and understanding the Windows Registry, where do we go, as an industry, to get the information we need?

Why does this even matter?

Well, an understanding of the Registry can provide insight into the target (admin, malicious insider, cyber
criminal, nation-state threat actor) by what they do, what they don't do, and how they go about doing it.

The Registry can be used to control a great deal of functionality and access on endpoints, going beyond just persistence. Various keys and values within the Registry can determine what we can see or not see, what we can do or not do, 

For example, let's say a threat actor enables RDP on an endpoint...this is something we see quite often. This could even be a Windows 10 or Windows 11 laptop; that is, it doesn't just have to be a server. When they enable it, do they also create a user account, add it to a group that has remote access, and then hide the new user account from the Welcome Screen? Do they enable Sticky Keys? Regardless of the various settings that they enable or disable, how do they go about doing so? Manually, or via a batch file or script of some kind?

The settings enabled or disabled, and the manner employed, can tell you something about the target. Are they prepared? Was it likely that they'd conducted some recon and developed some situational awareness of the environment, or as we see with many RaaS offerings, was it more of a "spray-and-pray" approach? If they used sc.exe (or some other means) to disable services, was that list specific and unique to the environment, or was it more of a "wish list" where many of the listed services didn't even exist on the endpoint?

Something that's been seen recently is the LogonType value being created, often as part of a batch file. This is interesting because the value itself appears to apply to Windows XP systems, but it's been seen being created on Windows 10 endpoints, as well as server variants of Windows. The order of the modifications, the timing between the modifications, and the position of the LogonType value within the list of modifications has been consistent across multiple endpoints, owned by unrelated customers. All of this, combined with the fact that the LogonType value apparently has no impact on the endpoints to which it was deployed, indicates that the "threat actor" is deploying this script of settings modifications without consideration for how "noisy" or unique it is.  

Okay, so let's consider persistence mechanisms, some of which can be a bit esoteric. For example, @0gtweet shared an interesting technique on 13 Dec 2022, and John Hammond shared a video of the technique on 12 May 2023. Now, if you take a really close look at it, this really isn't a "persistence" technique, per se, in the traditional sense...because in order to activate it, the threat actor has to have access to the system, or have some other means to run the "query" command. Maybe this could be used as a chained persistence technique; that is, what "persists" is the use of the "query" command, such as in an LNK file in the user's StartUp folder, or in another autoruns/persistence location, so that the "query" command is run, which in turn, runs the command created through the technique described by @0gtweet. 

So, consider this...threat actor compromises an admin account on an endpoint, and modifies the Registry so that the user accounts Startup folder is no longer the traditional "Startup" folder (i.e., "%userprofile%\AppData\Roaming\Microsoft\Windows\Start Menu\Programs\Startup"), but is something like "Temp". Then, they modify the "query" key with a value that launches their malware, or a downloader for their malware, and then drop an LNK file to run the new "query" entry in the new "Startup" location whenever that admin user logs in.

Now, here's something to think about...set this up and run it in a test environment, and see what the process lineage looks like, and try to figure out from that lineage what happened (i.e., working backwards). Pretty cool, eh?

Speaking of persistence, what about false flags? Say, the threat actor drops some "malware" on an endpoint, and adds a value to the Run key, but disables it. The SOC or DFIR analyst sees the Run key value being set and figures, "ah, gotcha!", and not knowing about other values within the Registry, doesn't understand that the value has been disabled. Just as with a military inspection, you leave something for the inspector to find so that they're satisfied and move on; in this case, the analyst may decide that they've sussed out the bad guy, delete the Run key value and referenced file, and move on...all while the threat actor's real persistence mechanism is still in place.

The point is, there's a good bit within the Registry that controls what access and capabilities the operating system and, to some extent, applications provide, and understanding that helps us understand a bit about the target we're interested in, whether they be a cyber criminal, threat actor, or malicious insider. 

Friday, May 05, 2023

Events Ripper Updates

As you may know, I'm a pretty big proponent for documenting things that we "see" or find during investigations, and then baking those things back into the parsing and decoration process, as a means of automating and retaining corporate knowledge. This means that something I see once can be added to the parsing, decoration, and enrichment process, so that I never have to remember to look for it again. Things I've seen before can be raised up through the "noise" and brought to my attention, along with any references or necessary context. This makes subsequent investigations more efficient, and gets me to where I'm actually doing analysis much sooner.

One of the ways I do this is by creating simple plugins for Events Ripper, a proof-of-concept tool for "mining" Windows Event Log data for pivot points that can be applied to analysis, and in particular timeline analysis. Events Ripper uses the events file, the intermediate step between normalizing Windows Event Log events into a timeline, extracting pivot points and allowing me to build the picture of what happened, and when, a great deal faster than doing so manually.

The recently created or updated plugins include:

sec4797.pl 
Check for "Microsoft-Windows-Security-Auditing/4797" events, indicating that a user account was checked for a blank password. I'd never seen these events before, but they popped up during a recent investigation, and helped to identify the threat actor's activity, as well as validate the compromised account they were using.

filter.pl 
"Microsoft-Windows-Security-Auditing/5156", and /5158 events; this plugin output is similar to what we see with ShimCache parsers, in that it lists the applications for which the Windows Filtering Platform allows connections, or allows to bind to a local port, respectively. Similar to "Service Control Manager" events illustrating a new service being installed, this plugin may show quite a few legitimate applications, but it's much easier to go through that list and see a few suspicious or malicious applications than it is to manually scroll through the timeline. Searching the timeline for those applications can really help focus the investigation on specific timeframes of activity.

defender.pl 
Windows Defender event IDs 1116, 1117, 2051, and 5007, all in a single plugin, allowing us to look for detections and modifications to Windows Defender. Some modifications to Windows Defender may be legitimate, but in recent investigations, exclusions added to Windows Defender have provided insight into the compromised user account, as well as the folders the threat actor used for staging their tools.

msi.pl
Source "MsiInstaller", with event IDs 11707 (successful product installation), 11724, and 1034 (both successful product removal).

scm.pl 
Combined several event IDs (7000, 7009, 7024, 7040, and 7045) events, all with "Service Control Manager" as the source, into a single plugin. This plugin is not so much the result of recent investigations, as it is the desire to optimize validation; a service being created or installed doesn't mean that it successfully runs each time the system is restarted.

appissue.pl 
Combined "Application Hang/1002", "Application Error/1000", and "Windows Error Reporting/1001" events into a single plugin, very often allowing us to see the threat actor's malware failing to function.

Each of the new or updated plugins is the result of something observed or learned during recent investigations, and allow me to find unusual or malicious events to use as pivot points in my analysis.

We can do the same things with RegRipper plugins, Yara or Sigma rules, etc. It simply depends upon your framework and medium.

Thursday, April 27, 2023

Program Execution

By now, I hope you've had a chance to read and consider the posts I've written discussing the need for  validation of findings (third one here). Part of the reason for this series was a pervasive over-reliance on single artifacts as a source of findings that I and others have seen within the community over the past 2+ decades. One of the most often repeated examples of this is relying on ShimCache or AmCache artifacts as evidence of program execution.

ShimCache
ShimCache, or AppCompatCache (the name of the Registry value where the data is found) is often looked to as evidence of program execution when really what it demonstrates is that the file was on the system.

From this blog post from Mandiant:

It is important to understand there may be entries in the Shimcache that were not actually executed.

There you go. That's from 2015. And this is why we need to incorporate artifacts such as the ShimCache into an overall constellation, rather then viewing artifacts such as these in isolation. This 13Cubed video provides a clear explanation regarding the various aspects of the ShimCache artifact as it relates to Windows 10; note that the title of the video includes "the most misunderstood artifact".

AmCache
AmCache is another one of those artifacts that is often offered up as "evidence of program execution", as seen in this LinkedIn post. However, the first referenced URL in that post belies the fact that this artifact is "evidence of program execution", as well as other statements in the post (i.e., that AmCache is "populated after system shutdown"). From the blog post:

During these tests, it was found that the Amcache hive may have artifacts for executables that weren’t executed at all.

A bit more extensive treatment of the AmCache artifact can be found here. While you may look at the PDF and think, "TL;DR", the short version is that an entry in the AmCache does not explicitly mean, by itself, that the file was executed.

The point is that research demonstrates that, much like the ShimCache artifact, we cannot simply look at an entry and state, "oh, that is evidence of program execution". Even if you don't want to take the time reach and digest either the blog post or the PDF, simply understand that by itself, an AmCache entry does not demonstrate evidence of program execution.

So, again...let's all agree to stop looking just to ShimCache or just to AmCache as evidence of program execution, and instead look to multiple data sources and to artifact constellations to establish whether a program was executed or not.

For some insight as to how ShimCache and AmCache can be used together, check out this blog post from WithSecure.

Keep in mind that even when combining these two artifacts, it still doesn't provide clear indications that the identified executable was launched, and successfully executed. We need to seek other artifacts (Windows Event Log, Registry, etc.) to determine this aspect of the executable.

PCA
Earlier this year, AboutDFIR.com published a blog post regarding a new artifact (new to Windows 11) that appears to demonstrate evidence of program execution. Much like other artifacts (see above), this one has nuances or conditions, in that you cannot look to it to demonstrate execution of all programs; rather this one seems to apply to either GUI programs, or CLI program launched via a GUI. This is important to remember, whether you see an application of interest listed in one of the artifacts, or if you don't...context matters.

The blog post provides insight into the artifacts, as well as images of the artifacts, and samples you can download and examine yourself. This YouTube video mentions another associated artifact; specifically, Windows Event Log records of interest. Adding the artifacts to a timeline is a pretty trivial exercise; the text-based artifacts are easy to script, and the process for adding Windows Event Logs to a timeline is something that already exists.