Tuesday, September 20, 2022

ResponderCon Followup

I had the opportunity to speak at the recent ResponderCon, put on by Brian Carrier of BasisTech. I'll start out by saying that I really enjoyed attending an in-person event after 2 1/2 yrs of virtual events, and that Brian's idea to do something a bit different (different from OSDFCon) worked out really well. I know that there've been other ransomware-specific events, but I've not been able to attend them.

As soon as the agenda kicked off, it seemed as though the first four presentations had been coordinated...but they hadn't. It simply worked out that way. Brian referenced what he thought my content would be throughout his presentation, I referred back to Brian's content, Allan referred to content from the earlier presentations, and Dennis's presentation fit right in as if it were a seamless part of the overall theme. Congrats to Dennis, by the way, not only for his presentation, but also on his first time presenting. Ever.

During his presentation, Brian mentioned TheDFIRReport site, at one point referring to a Sodinokibi write-up from March, 2021. That report mentions that the threat actor deployed the ransomware executable to various endpoints by using BITS jobs to download the EXE from the domain controller. My presentation focused less on analysis of the ransomware EXE and more on threat actor behaviors, and Brian's mention of the above report (twice, as a matter of fact) provided excellent content. In particular, for the BITS deployment to work, the DC would have to (a) have the IIS web server installed and running, and (b) have the BITS server extensions installed/enabled, so that the web server knew how to respond to the BITS client requests. As such, the question becomes, did the victim org have that configuration in place for a specific reason, or did the threat actor modify the infrastructure to meet their own needs? 

However, the point is that without prior coordination or even really trying, the first four presentations seemed to mesh nicely and seem as if there was detailed planning involved. This is likely more due to the particular focus of the event, combined with some luck delivered when the organizing team decided upon the agenda. 

Unfortunately, due to a prior commitment (Tradecraft Tuesday webinar), I didn't get to attend Joseph Edwards' presentation, which was the one presentation I wanted to see (yes, even more than my own!).  ;-) I am going to run through the slides (available from the agenda and individual presentation pages), and view the presentation recording once it's available. I've been very interested in threat actor's use of LNK files and the subsequent use (or rather, lack thereof) by DFIR and threat intel teams. The last time I remember seeing extensive use of threat actor-delivered LNK files was when the Mandiant team compared Cozy Bear campaigns.

Going through my notes, comments made during one presentation kind of stood out, in that "event ID 1102" within the RDPClient/Operational Event Log was mentioned when looking for indications of lateral movement. The reason this stood out, and why I made a specific note, was due to the fact that many times in the industry, we refer to simply "event IDs" to identify event records; however, event IDs are not unique. For example, we most often think of "event log cleared" when someone says "event ID 1102"; however, it can mean something else entirely based on the event source (a field in the event record, not the log file where it was found). As a result, we should be referring to Windows Event Log records by their event source/ID pairs, rather than solely by their event ID. 

Something else that stood out for me was that during one presentation, the speaker was referring to artifacts in isolation. Specifically, they listed AmCache and ShimCache each as artifacts demonstrating process execution, and this simply isn't the case. It's easy for many who do not follow this line of thought to dismiss such things, but we have to remember that we have a lot of folks who are new, junior, or simply less experienced in the industry, and if they're hearing this messaging, but not hearing it being corrected, they're going to assume that this is how things are, and should be, done.

What Next?
ResponderCon was put on by the same folks that have run OSDFCon for quite some time now, and it seems that ResponderCon is something a bit more than just a focused version of OSDFCon. So, the question becomes, what next? What's the next iteration, or topic, or theme? 

If you have thoughts, insights, or just ideas you want to share, feel free to do so in the comments, or via social media, and be sure to include/tag Brian.
Monday, September 19, 2022

Deconstructing Florian's Bicycle

Not long ago, Florian Roth shared some fascinating thoughts via his post, The Bicycle of the Forensic Analyst, in which he discusses increases in efficiency in the forensic review process. I say "review" here, because "analysis" is a term that is often used incorrectly, but that's for another time. Specifically, Florian's post discusses efficiency in the forensic review process during incident response.

After reading Florian's article, I had some thoughts that I wanted share to that would extend what he's referring to, in part because I've seen, and continue to see the need for something just like what is discussed. I've shared my own thoughts on this topic previously.

My initial foray into digital forensics was not terribly different from Florian's, as he describes in his article. For me, it wasn't a lab crammed with equipment and two dozen drives, but the image his words create and perhaps even the sense of "where do I start?" was likely similar. At the same time, this was also a very manual process...open images in a viewer, or access data within images via some other means, and begin processing the data. Depending upon the circumstances, we might access and view the original data to verify that it *can* be viewed, and at that point, extract some modicum of data (referred to as "triage data") to begin the initial parsing and data presentation process before kicking off the full acquisition process. But again, this has often been a very manual process, and even with checklists, it can be tedious, time consuming, and prone to errors.

Over the years, analysts have adopted something similar to what Florian describes, using such tools as Yara, Thor (Lite), log2timeline/plaso, or CyLR. These are all great tools that provide considerable capabilities, making the analyst's job easier when used appropriately and correctly. I should note that several years ago, extensions for Yara and RegRipper were added to the Nuix Workstation product, putting the functionality and capability of both tools at the fingertips of investigators, allowing them to significantly extend their investigations from within the Nuix product. This is an example of how a commercial product provided the ability of its users to leverage the freeware tools in their parsing and data presentation process.

So, where does the "bicycle" come in? Florian said:

Processing the large stack of disk images manually felt like being deprived of something essential: the bicycle of forensic analysts.

His point is, if we have the means for creating vast efficiencies in our work, alleviating ourselves of manual, time-consuming, error-prone processes, why don't we do so? Why not leverage scanners to reduce our overhead and make our jobs easier?

So, what was achieved through Florian's use of scanners?

The automatic processing of the images accelerated our analysis a lot. From a situation where we processed only three disk images daily, we started scanning every disk image on our desk in a single day. And we could prioritize them for further manual analysis based on the scan reports.

Florian's article continues with a lot of great information regarding the use of scanners, and applying detection engineering to processing acquired images and data. He also provides examples of rules to identify the misuse/abuse of common tools. 

All of this is great, and it's something we should all look to in our work, keeping two things in mind. First, if we're going to download and use tools created by others (Yara/Thor, plaso, RegRipper, etc.), we have to understand what the tools actually do. We can't make assumptions about the tools and the functionality they provide, as these assumptions lead to significant gaps in analysis. By way of example, in March, 2020, Microsoft published a blog article addressing human-operated ransomware attacks. In that article, they identified a ransomware group that used WMI for persistence, and the team I was engaged with at the time received data from several customers impacted by that ransomware group. However, the team was unable to determine if WMI had been used for persistence because the toolset they were using to parse data did not have the capability to parse the OBJECTS.DATA file. The collection process included this file, but the parsing process did not parse the file for persistence mechanisms, and as a result, analysts assumed that the data had been parsed and yielded a negative response.

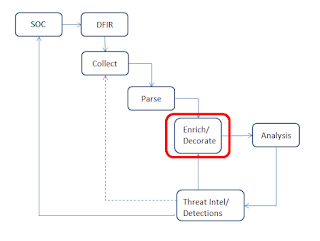
Fig 1: New DFIR Model
Second, we cannot download a tool and use it, expecting it to be up-to-date 6 months or a year later, unless we actually take steps to update it. And I'm not talking about going back to the original download site and getting more rules. The best way to go about updating the tools is it use the scanners as Florian described, leveraging the efficiencies they provide, but to then bake new findings as a result of our analysis back into the overall DFIR process, as illustrated in figure 1. Notice that following the "Analysis" phase, there's a loop that feeds back into the "Collect" phase (in case there's something additional that needs to be collected from a system) and then proceeds to the "Parse" phase, where those scanners and rules Florian described are applied. They can then be further used to enrich and decorate the data prior to presentation to the analyst. The key to this feedback loop is that rather than solely the knowledge and experience of the analyst assigned to an engagement being applied to the data, the collective corporate knowledge of all analysts, prior analysts, detection engineers, and threat intel analysts can be applied consistently to all engagements. 

So, to truly leverage the efficiencies of Florian's scanner "bicycles", we need to continually extend them by baking findings developed through analysis, digging into open reports, etc., back into the process.

Saturday, September 10, 2022

AmCache Revisited

Not long ago, I posted about When Windows Lies, and that post really wasn't so much about Windows "lying", per se, as it was about challenging analyst assumptions about artifacts, and recognizing misconceptions. Along the same lines, I've also posted about the (Mis)Use of Artifact Categories, in an attempt to address the reductionist approach that leads analysts to oversimplify and subsequently misinterpret artifacts based on their perceived category (i.e., program execution, persistence, lateral movement, etc.). This misinterpretation of artifacts can lead to incorrect findings, and subsequently, incorrect recommendations for improvements to address identified issues.

I recently ran across this LinkedIn post that begins by describing AmCache entries as "evidence of execution", which is somewhat counter to the seminal research conducted by Blanche Lagney regarding the AmCache.hve file, particularly with more recent versions of Windows 10. If you prefer a more auditory approach, there's also a Forensic Lunch where Blanche discussed her research (starts around 12:45), thanks to David and Matt! Suffice to say, data from the AmCache.hve file should not simply be considered as "evidence of execution", as it's far too reductionist; the artifact is much more nuanced that simply "evidence of execution". This overly simplistic approach is indicative of the misuse of artifact categories I mentioned earlier.

Unfortunately, misconceptions as to the nature and value of artifacts such as this (and others, most notably, ShimCache) continue to exist because we continue to treat the artifacts in isolation, rather than as part of a system. Reviewing Blanche's paper in detail, for example, makes it clear that the value of specific portions of the AmCache data depend upon such factors as which keys/values are in question, as well as which version of Windows is being discussed. Given these nuances, it's easy to see how a reductionist approach evolves, leaving us simply with "AmCache == execution". 

What we need to do is look at artifacts not in isolation, but in context with other data sources (Registry, WEVTX, etc.). This is important because artifacts can be manipulated; for example, there've been instances where malware (a PCI scraper) was written to disk and immediately "time stomped", using the time stamps from kernel32.dll to make it appear that the malware had always been part of the system. As a result, when the $STANDARD_INFORMATION attribute last modification time was included in the ShimCache entry for the malware, the analyst misinterpreted this as the time of execution, and reported a "window of compromise" of 4 years to the PCI Council, rather than a more correct 3 weeks. The "window of compromise" reported by the analyst is used, in part, to determine fines to be levied against the merchant/victim. 

So, yes...we need to first learn about artifacts by themselves, as we begin learning. We need to develop an understanding of the nature of an artifact, particularly how many artifacts and IOCs need to be viewed as compound objects (shoutz to Joe Slowik!). However, when we get to the next artifact, we then need to start viewing artifacts in the context of other artifacts, and understand how to go about developing artifact constellations that help us clearly demonstrate the behaviors we're seeing, the behaviors that drive our findings.

The overall take-away here, as with other instances, is that we have to recognize when we're viewing artifacts in isolation, and then avoid doing so. If some circumstance prevents correlation across multiple data sources, then we need to acknowledge this in our reporting, and clearly state our findings as such.

Saturday, September 03, 2022

LNK Builders

I've blogged a bit...okay, a LOT...over the years on the topic of parsing LNK files, but a subject I really haven't touched on is LNK builders or generators. This is actually an interesting topic because it ties into the cybercrime economy quite nicely. What that means is that there are "initial access brokers", or "IABs", who gain and sell access to systems, and there are "RaaS" or "ransomware-as-a-service" operators who will provide ransomware EXEs and infrastructure, for a price. There are a number of other for-pay services, one of which is LNK builders.

In March, 2020, the Checkpoint Research team published an article regarding the mLNK builder, which at the time was version 2.2. Reading through the article, you can see that the building includes a great deal of functionality, there's even a pricing table. Late in July, 2022, Acronis shared a YouTube video describing how version 4.2 of the mLNK builder available.

In March, 2022, the Google TAG published an article regarding the "Exotic Lily" IAB, describing (among other things) their use of LNK files, and including some toolmarks (drive serial number, machine ID) extracted from LNK metadata. Searching Twitter for "#exoticlily" returns a number of references that may lead to LNK samples embedded in archives or ISO files. 

In June, 2022, Cyble published an article regarding the Quantum LNK builder, which also includes features and pricing scheme for the builder. The article indicates a possible connection between the Lazarus group and the Quantum LNK builder; similarities in Powershell scripts may indicate this connection.

In August, 2022, SentinelLabs published an article that mentioned both the mLNK and Quantum builders. This is not to suggest that these are the only LNK builders or generators available, but it does speak to the prevalence of this "*-as-a-service" offering, particularly as some threat actors move away from the use of "weaponized" (via macros) Office documents, and toward the use of archives, ISO/IMG files, and embedded LNK files.

Freeware Options
In addition to creating shortcuts through the traditional means (i.e., right-clicking in a folder, etc.), there are a number of freely available tools that allow you to create malicious LNK files. However, from looking at them, there's little available to indicate that they provide the same breadth of capabilities as the for-pay options listed earlier in this article. Here's some of the options I found:

lnk-generator (circa 2017)
Booby-trapped shortcut (circa 2017) - includes script
LNKUp (circa 2017) - LNK data exfil payload generator
lnk-kisser (circa 2019) - payload generator
pylnk3 (circa 2020) - read/write LNK files in Python
SharpLNKGen-UI (circa 2021) - expert mode includes use of ADSs (Github)
Haxx generator (circa 2022) - free download
lnkbomb - Python source, EXE provided
lnk2pwn (circa 2018) - EXE provided
embed_exe_lnk - embed EXE in LNK, sample provided 

Next Steps
So, what's missing in all this is toolmarks; with all these options, what does the metadata from malicious LNK files created using the builders/generators look like? Is it possible that given a sample or enough samples, we can find toolmarks that allow us to understand which builder was used?

Consider this file, for example, which shows the parsed metadata from several samples (most recent sample begins on line 119). The first two samples, from Mandiant's Cozy Bear article, are very similar; in fact, they have the same volume serial number and machine ID. The third sample, beginning on line 91, has a lot of the information we'd look to use for comparison removed from the LNK file metadata; perhaps the description field could be used instead, along with specific offsets and values from the header (given that the time stamps are zero'd out). In fact, besides zero'd out time stamps, there's the SID embedded in the LNK file, which can be used to narrow down a search.

The final sample is interesting, in that the PropertyStoreDataBlock appears to be well-populated (unlike the previous samples in the file), and contains information that sheds light on the threat actor's development environment.

Perhaps, as time permits, I'll be able to use a common executable (the calculator, Solitaire, etc.), and create LNK files with some of the freeware tools, noting the similarities and differences in metadata/toolmarks. The idea behind this would be to demonstrate the value in exploring file metadata, regardless of the actual file, as a means of understanding the breadth of such things in threat actor campaigns.

Analysis: Situational Awareness + Timelines

I've talked and written about timelines as an analysis process for some time, in both this blog and in my books, because I've seen time and again over the years the incredible value in approaching an investigation by developing a timeline (including mini- and micro-timelines, and overlays), rather than leaving the timeline as something to be manually created in a spreadsheet after everything else is done.

Now, I know timelines can be "messy", in part because there's a LOT of activity that goes on on a system, even when it's "idle", such as Windows and application updates. This content can "muck up" a timeline and make it difficult to distill the malicious activity, particularly when discerning that malicious activity is predicated solely on the breadth of the analyst's knowledge and experience. Going back to my early days of "doing" IR, I remember sitting at an XP machine, opening the Task Manager, and seeing that third copy of svchost.exe running. I'd immediately drill in on that item, and the IT admin would be asking me, "...what were you looking at??" The same is true when it comes to timelines...there are going to be things that will immediately jump out to one analyst, were another analyst may not have experienced the same thing, and not developed the knowledge that this particular event was "malicious", or at least suspicious.

As such, one of the approaches I've used and advocated is to develop situational awareness via the use of mini- or micro-timelines, or overlays. A great example of this approach can be seen in the first IronMan movie, when Tony's stuck in the cave and in order to hide the fact that he's building his first suit of armor, he has successive parts of the armor drawn on thin paper. The image of the full armor only comes into view when the papers are laid on top of one another. I figured that this would be a much better example than referring to overhead projectors and cellophane sheets, etc., that those of us who grew up in the '70s and '80s are so very familiar with.

Now, let's add to that the idea of "indicators as composite objects". I'm not going to go into detail discussing this topic, because I stole borrowed it from Joe Slowik; to get a really good view into this topic, give Joe's RSA 2022 presentation a listen; it's under an hour and chock full of great stuff!

So, what this means is that we're going to have events in our timeline that are really composite objects. This means that the context of those events may not be readily available or accessible for a single system or incident. For example, we may see a "Microsoft-Windows-Security-Auditing/4625" event in the timeline, indicating a failed login attempt. But that event also includes additional factors...the login type, the login source, username, etc., all of which can have a significant impact...or not...on our investigation. But here we have a timeline with hundreds, or more likely, thousands of events, and no real way to develop situational awareness beyond our own individual experiences. 

Or, do we?

In order to try to develop more value and insight from timeline data, I developed Events Ripper, a proof of concept tool based on RegRipper that provides a means for digging deeper into individual events and providing analysts with insight and situational awareness they might not otherwise have, due to the volume of data, lack of experience, etc. In addition to addressing the issue of composite objects, this tool also serves, like RegRipper, to preserve corporate knowledge and intrusion intel, in that a plugin developed by one analyst is shared with all analysts, and the wealth of that analyst's knowledge and experience is available to the rest of the team regardless of their status, in an operational manner.

The basic idea behind Events Ripper is that an analyst is developing a timeline and wants to take things a step further and develop some modicum of situational awareness. The timeline process used results in an "events file" being created; this is an intermediate file between the raw data ($MFT, *.evtx, Registry hives, SRUM DB, etc.) and the timeline. The "events file" is a text file, with each line consisting of an event in the 5-field TLN format. 

For example, one plugin runs across all login (Security-Auditing/4624) events, and distinguishes between type 2, 3, and 10 logins, and presents source IP addresses for the type 3 and type 10 logins. Using this plugin, I was able to quickly determine that a system was accessible from the raw Internet via both file sharing and RDP. Another plugin does something similar for failed logins, in addition to translating the sub-status reason for the failed attempt.

The current set of plugins available with the tool are focused on Windows Event Log records from some of the various log files. As such, an analyst can run Events Ripper across an events file consisting of multiple data sources, or can opt to do so after parsing just the Windows Event Log files, as described in the tool readme. As this is provided as a standalone Windows executable, it can also be included in an automated process where data is received through 'normal' intake processes, and then parsed prior to being presented to the analyst. 

Like RegRipper, Events Ripper was intended for the development and propagation of corporate knowledge. You can write a plugin that looks for something specific in an event, a combination of elements within an event, or correlate events across the events file, and add Analysis Tips to the plugin, sharing things like reference URLs and other items the analyst may want to consider. Adding this plugin to your own corporate repo means that the experience and knowledge developed in investigating and unraveling this event (or combination of events) is no longer limited or restricted to just the analyst who did that work; now, it's shared with all analysts, even those who haven't yet joined your team.

At the moment, there are 16 plugins, but like RegRipper, this is likely to expand over time as new investigations develop and new ways of looking at the data are needed.