Sunday, December 31, 2023

2023 Wrap-up

Another trip around the sun is in the books. Looking back over the year, I thought I'd tie a bow on some of the things I'd done, and share a bit about what to expect in the coming year.

In August, I released RegRipper 4.0. Among the updates are some plugins with JSON output, and I found a way to integrate Yara into RegRipper.

I also continued updating Events Ripper, which I've got to say, has proven (for me) time and again to be well worth the effort, and extremely valuable. As a matter of fact, within the last week or so, I've used Events Ripper to great effect, specifically with respect to MSSQLServer, not to "save my bacon", as it were, but to quickly illuminate what was going on on the endpoint being investigated. 

For anyone who's followed me for a while, either via my blog or on LinkedIn or X, you'll know that I'm a fan of (to steal a turn of phrase from Jesse Kornblum) "using all the parts of the buffalo", particularly when it comes to LNK file metadata.

For next year, I'm working on an LNK parser that will allow you to automatically generate a bare-bones Yara rule for detecting other similar LNK files (if you have a repository from a campaign), or submitting as a retro-hunt to VirusTotal. 

Finally, I'm working on what I hope to be the first of several self-published projects. We'll see how the first one goes, as the goal is to provide the foundation of other subsequent projects.

That being said, I hope everyone had a great 2023, and that you're looking forward to a wonderful 2024...even though for many of us, it's probably going to be April before we realize that we're writing 2023 on checks, etc.

Monday, December 18, 2023

Round Up

MSSQL is still a thing
TheDFIRReport recently posted an article regarding BlueSky ransomware being deployed following MSSQL being brute forced. I'm always interested in things like this because it's possible that the author will provide clear observables so that folks can consider the information in light of their infrastructure, and write EDR detections, or create filter rules for DFIR work, etc. In this case, I was interested to see how they'd gone about determining that MSSQL had been brute forced.

You'll have to bear with me...this is one of those write-ups where images and figures aren't numbered. However, in the section marked "Initial Access", there's some really good information shared, specifically where it says, "SQL Server event ID 18456 Failure Audit Events in the Windows application logs:"...specifically, what they're looking at is MSSQLServer/18456 events in the Application Event Log, indicating a failed login attempt to the server (as opposed to the OS). This is why I wrote the Events Ripper mssql.pl plugin. I'd seen a number of systems running Veeam and MSSQL, and needed a straightforward, consistent, repeatable means to determine if  a compromise of Veeam was the culprit, or if something else had occurred.


LNK Files

TheDFIRSpot had an interesting write-up on using LNK files in your investigations, largely from the perspective of determining what a user or threat actor may have done or accessed while logged in via the Windows Explorer shell. Lining up creation and last modification times of shortcuts/LNK files in the account's Recent folder can provide insight into what might have occurred. Again, keep in mind that for this to work, for the LNK files to be present, access was obtained via the shell (Windows Explorer). If that's the case, then you're likely going to also want to look at the automatic JumpLists, as they will provide similar information, and LNK files in the Recent folder, and the RecentDocs and shellbags keys for the account can provide a great deal of insight into, and validation of activity. Note that automatic JumpLists are OLE/structured storage format files, with the individual streams consisting of data that follows the LNK format.

While I do agree that blog posts like this are extremely valuable in reminding of us of the value/importance of certain artifacts, we need to take an additional step to normalize a more comprehensive approach; that is, we need to consistently drive home the point that we shouldn't just be looking at a single artifact. We need to normalize and reinforce the understanding that there is no go-to artifact for any evidence category, when we should be considering artifact constellations, and that constellation will depend upon the base OS version and software load of the endpoint. Understanding default constellations, as part of a base software load (OS, minimal applications) is imperative, as is having a process to build out that constellation based on additional installed software (Sysmon, LANDesk Software Monitoring, etc.).

Something to keep in mind is that access via the shell has some advantages for the threat actor, one being that using GUI tools means that EDR is blind to most activity. EDR tools are great at recording process creation events, for example, but when the process (explorer.exe) already exists, what happens via the process that does not involve cmd.exe, PowerShell, WSL, or WSA (Windows Subsystem for Android) may not be visible to EDR. Yes, some EDR frameworks also monitor network connections, as well as Registry and file system modifications, but by necessity, those are often filtered. When a GUI tool is opened, EDR based on process creation events is largely blind to activity that occurs via drop-down boxes, check boxes, text fields, and buttons being pushed.

For example, check out this recent Huntress blog where curl.exe was observed being used for data exfil (on the heels of this Huntress blog showing finger.exe being used for data exfil). In the curl blog, there's a description of MemProcFS being used for memory dumping; using a GUI tool essentially "blinds" EDR, because you (the analyst) can't see which buttons the threat actor pushes. We can assume that the 4-digit number listed in the minidump file path was the process ID, but the creation of that process was beyond the data retention window (the endpoint had not been recently rebooted...), so we weren't able to verify which process the threat actor targeted for the memory dump.

Malware Write-ups
Malware and threat actor write-ups need to include clear observables so that analysts can implement them, whether they're doing DFIR work, threat hunting, or working on writing detections. Here is Simone Kraus's write-up on the Rhysida ransomware; I've got to tell you, it's chock full of detection and hunting opportunities. Like many write-ups, the images and listings aren't numbered, but about 1/4 of the way down the blog post, there's a listing of reg.exe commands meant to change the wallpaper to the ransom note, many of which are duplicates. What I mean by that is that you'll see a "cmd /c reg add" command, followed by a "reg.exe add" command with the same arguments in the command line. As Simone says, these are commands that the ransomware would execute...these commands are embedded in the executable itself; this is something we see with RaaS offerings, where commands for disabling services and the ability to recover the system are embedded within the EXE itself. In 2020, a sample of the Sodinokibi ransomware contained 156 unique commands, just for shutting off various Windows services. If your EDR tech allows for monitoring the Registry and disabling processes at the endpoint, this may be a good option to enable automated response rules. Otherwise, detecting these processes can lead to isolating endpoints, or the values themselves can be used for threat hunting across the enterprise.

Something else that's interesting about the listing is that  the first two entries are misspelled; since the key path doesn't exist by default, the command will fail. It's likely that Simone simply cut-n-pasted these commands, and since they're embedded within the EXE, they likely will not be corrected without the EXE being recompiled. This misspelling provides an opportunity for a high fidelity threat hunt across EDR telemetry.

Monday, December 11, 2023

...and the question is...

I received an interesting question via LinkedIn not long ago, but before we dive into the question and the response...

If you've followed me for any amount of time, particularly recently, you'll know that I've put some effort forth in correcting the assumption that individual artifacts, particularly ShimCache and AmCache, provide "evidence of execution". The is a massive oversimplification of the nature and value of each of these artifacts, in addition to just being an extremely poor analytic process; that is, viewing single artifacts in isolation to establish a finding.

Okay, so now, the question I was asked was, what is my "go to" artifact to demonstrate evidence of execution?

First, let me say, I get it...I really do. During my time in the industry, I've heard customers ask, "..what is the product I need to purchase to protect my infrastructure?", so an analyst asking, "...what is the artifact that illustrates evidence of execution?" is not entirely unexpected. After all, isn't that the way things work sometimes? What is the one thing, which button do I push, which is the lever I pull, what is the one action I need to take, or one choice I need to make to move forward?

So, in a way, the question of the "go to" artifact to demonstrate...well, anything...is a trick question. Because there should not be one. Looking just at "evidence of execution", some might think, "...well, there's Prefetch files...right?", and that's a good option, but what do we know about application prefetching? 

We know that the prefetcher monitors the first 10 seconds of execution, and tracks files that are loaded.

We know that beginning with Windows 8, Prefetch files can hold up to 8 "last run" times, embedded within the file itself. 

We know that application prefetching is enabled by default on workstations, but not servers. 

Okay, this is great...but what happens after those first 10 seconds? What I mean is, what happens if code within the program throws an error, doesn't work, or the running application is detected by AV? Do we consider that the application "executed" only if it started, or do we consider "evidence of execution" to include the application completing, and impacting the endpoint in some manner?

So, again, the answer is that there is no "go to" artifact. Instead, there's a "go to" process, one that includes multiple, disparate data sources (file system, Registry, WEVTX, SRUM, etc.), normalized and correlated based on some common element, such as time. Windows Event Log records include time stamps, as do MFT records, Registry keys and some values.

Our analytic process needs to encompass two concepts...artifact constellations, and validation. First off, we don't ever look at single artifacts to establish findings; rather, we need to incorporate multiple, disparate data sources, through a process of parsing, normalization, decoration and enrichment to truly determine the context of an event. Looking at just a log entry, or entry from EDR telemetry by itself does not truly tell us if something executed successfully. If it was launched, did it complete successfully? Did it have the intended impact on the endpoint, leaving traces of its execution?

Second, artifact constellations lead to validation. By looking at multiple, disparate data sources, we can determine if what we thought was executed, what appeared to have been executed, was able to "survive". For example, I've seen malware launched, visible through EDR telemetry and log sources, that never succeeded. Each time it launched, it generated an error, per Windows Error Reporting. I've seen malicious installation processes (MSI files) fail to install. I've seen threat actors push out their ransomware EXE to multiple endpoints and run each instance, resulting in files on those systems being encrypted, but not be able to get the executable to run on the nexus endpoint; I've seen threat actors run their ransomware EXE multiple times with the "--debug" option, and the files on that endpoint were never encrypted.

If you're going to continue to view single artifacts in isolation, then please understand the nature and nuance of the artifacts themselves. Thoroughly review (and understand) this research regarding AmCache, as well as Mandiant's findings regarding ShimCache. However, over the years, I've found it so much more straightforward to incorporate these artifacts into an overall analysis process, as it continually demonstrates the value of the individual artifacts, as well as provides insights into the intent and capabilities of the threat actor.

Tuesday, November 28, 2023

Roll-up

One of the things I love about the industry is that it's like fashion...given enough time, the style that came and went comes back around again. Much like the fashion industry, we see things time and again...just wait.

A good example of this is the finger application. I first encountered finger toward the end of 1994,

during my first 6 months in grad school. I was doing some extracurricular research, and came across a reference to finger as making systems vulnerable, but it wasn't clear why. I asked the senior sysadmin in our department; they looked at me, smiled, and walked away.

Jump forward about 29 years to just recently, and I saw finger.exe, on a Windows system, used for data exfiltration. John Page/hyp3rlinx wrote an advisory (published 2020-09-11) describing how to do this, and yes, from the client side, what I saw looked like it was taken directly from John's advisory.

What this means to us is that the things we learn may feel like they fade with time, but wait long enough, and you'll see them, or some variation, again. I've seen this happen with ADSs; more recently, the specific MotW variations have taken precedence. I've also seen it happen with shell items (i.e., the "building blocks" of LNK files, JumpLists, and shellbags), as well as with the OLE file format. You may think, "...man, I spent all that time learning about that thing, and now it's no longer used..."; wait. It'll come back, like bell bottoms.

Deleted Things
In DFIR, we often say that just because you delete something, that doesn't mean that it's gone. For files, Registry keys and values, etc., this is all very true.

Scheduled Tasks
A while back, I blogged about an ops debrief call that I'd joined, and listened to an analyst discuss their findings from their engagement. At the beginning of the call, they'd mentioned something, almost in passing, glossing over it like it was inconsequential; however, some research revealed that it was actually an extremely high-fidelity indicator based on specific threat actor TTPs.

In many instances, threat actors will create Scheduled Tasks as a means of persisting on endpoints. In fact, not too long ago, I saw a threat actor create two Scheduled Tasks for the same command; one to run based on a time trigger, and the other to run ONSTART. 

In the case this analyst was discussing, the threat actor had created a Scheduled Task on a Windows 7 (like I said, this was a while back) system. The task was for a long-running application; essentially, the application would run until it was specifically stopped, either directly or by the system being turned off. Once the application was launched, the threat actor deleted the Scheduled Task, removing to the XML and binary task files; Windows 7 used a combination of the XML-format task files we see today on Windows 10 and 11 endpoints, as well as the binary *.job file format we saw on Windows XP.

Volume Shadow Copies
About 7 yrs ago or so, I published a blog post that included a reference to a presentation from 2016, and to a Carbon Black blog post that had been published in August, 2015. The short version of what was discussed in both was that a threat actor performed the following:

1. Copied their malware EXE to the root of a file system.
2. Created a Volume Shadow Copy (VSC).
3. Mounted the VSC they'd created, and launched the malware/Trojan EXE from within the mounted VSC.
4. Deleted the VSC they'd created, leaving the malware EXE running in memory.

I tried replicating this...and it worked. Not a great persistence mechanism...reboot the endpoint and it's no longer infected...but fascinating nonetheless. What's interesting about this approach is that if the endpoint hadn't had an EDR agent installed, all a responder would have available to them by dumping process information from the live endpoint, or by grabbing a memory dump, is a process command line with a file path that didn't actually exist on the endpoint. 

WSL
We've known about the Windows Subsystem for Linux (WSL) for a while. 

Not too long ago, an academic paper addressing WSL2 forensics was published illustrating artifacts associated with the installation and use of Linux distributions. The authors reference the use of RegRipper (version 3.0, apparently) in several locations, particularly when examining the System and Software Registry hives; for some reason, they chose to not use RegRipper to parse the AmCache.hve file. 

Now, let's keep our eyes open for a similar paper on the Windows Subsystem for Android...just sayin'...

Friday, November 10, 2023

Roll-up

I don't like checklists in #DFIR. 

Rather, I don't like how checklists are used in #DFIR. Too often, they're used as a replacement for learning and knowledge, and looked at as, "...if I do just this, I'm good...". Nothing could be further from the truth, which is why even in November 2023, we still see analysts retrieving just the Security, Application, and System Event Logs from Windows 10 & 11 endpoints.

I'm also not a fan of lists in #DFIR. Rather than a long list of links with no context or insight, I'd much rather see just a few links with descriptions of how useful they are (or, they aren't, as the case may be...), and how they were incorporated into an analysis workflow.

SRUM DB
Shanna Daly recently shared some excellent content regarding SRUMDB, excellent in the sense that it was not only enjoyable to read, but it was thorough in its content, particularly regarding the fact that the database contents are written on an hourly basis. As such, this data source is not a good candidate for being included in a timeline, but it is an excellent pivot point.

This is where timelines and artifact constellations cross paths, and lay a foundation for validation of findings. Most analysts are familiar with ShimCache and AmCache artifacts, but many still mistakenly believe that these are "evidence of execution"; in fact, the recently published Windows Forensics Analysts Field Guide states this, as well. So, what happens is that analysts will see an entry in either artifact for apparent malware and declare victory, basing their finding on that one artifact, in isolation. All either of these artifacts tells us definitively is that file existed on the endpoint; we need additional information, other elements of the constellation, to confirm execution. So, there's Prefetch files...unless you're examining a server. One place to pivot to for validation is the SRUM DB, which Shanna does a thorough job of addressing and describing. 

Dev Drive
Grzegorz recently tweeted regarding Windows "dev drive" (LinkedIn post here), a capability that allows a developer to optimize an area of their hard drive for storage operations. Apparently, part of this allows the developer to "disallow" AV, which sounds similar to designating exclusions in Windows Defender. However, in this case, it sounds as if it's for all AV, not just Defender. 

MS provides information on "dev drive", including describing how to enable it via GPO.

Finger
I was doing some research recently for a blog post on the use of finger.exe for both file download, as well as exfil, and ran across a couple of very similar articles and posts, all of which seemed to be derived from a single resource (from hyp3rlinx).

And yes, you read that right...the LOLBin/LOLBAS finger.exe used for data exfil. When I was in graduate school and working on my master's thesis (late '95 through '96), I was teaching myself Java programming in order to facilitate data collection for my thesis. As part of my self-study, I wrote networking code to implement SMTP, finger, etc., clients on Windows (at the time, Windows 3.11 for Workgroups and Windows 95). However, at the time, I wasn't as focused on things like data exfil and digital forensics...rather, I was focused on implementing networking sockets and protocols to replicate various client applications. What's wild about this one is that I don't think I ever expected to see it "in the wild", but in October 2023, I did. 

Actively used, "in the wild". 

And to be quite honest, it's pretty freaking cool!  

Ancillary to this, something I've encountered/been thinking of for some time now is that there are things that have been around for years that have confounded current analysis and led to mistakes via assumptions. For example, about 40 or so years ago, I took a BASIC programming course (on the Mac IIe), and one of the first things we learned was preceding lines to be "commented out" with "REM". Commenting lines was part of the formal instruction, using "REM" as a "poor man's debugger" was part of the informal instruction. Anyway, I've seen "obfuscated" code that contained long strings of what looked like base64-encoded lines, only to see them preceded by "REM" or an apostrophe. And yet, instead of skipping those lines, some analysts have been bogged down trying to decode the apparent base64-encoded strings. 

Another example is NTFS alternate data streams (ADSs). This NTFS file system artifact has been around since...well...NTFS, but there are more than a few analysts who haven't experienced them and aren't familiar with them. 

The point of this isn't to point out shortcomings in training, education, experience, or knowledge; rather, that threat actors can use (and have used) something "old" with great success, because it's not recognized by current analysts. Think about it for a second...think DOS batch files are "lame" when compared to PowerShell or some more "modern" scripting languages? They may be but they work, really well, in fact. There's two Windows Event Logs that PowerShell code can end up in, but batch files don't get "recorded" anywhere. Further, there are some pretty straightforward things you can do with DOS batch files that will not only work, but have the added benefit of confusing the crap out of "modern" analysts. 

So, here's something to think about...there's a lot of different ways to data exfiltration as part of recon activities, but one that folks may not be expecting is to do so via finger.exe. Do you employ EDR technology, or have an MDR? If so, how often is finger.exe launched in your infrastructure? Would it be a good idea to have a rule that simply monitors for the execution of that LOLBAS?

Monday, October 09, 2023

Investigating Time Stomping

Some analysts may be familiar with the topic of time stomping, particularly as it applies to the NTFS file system, and is explained in great detail by Lina Lau in her blog. If you're not familiar with the topic, give Lina's article a very thorough read-thru. This can be important, as threat actors have been observed modifying time stamps on the files they drop on endpoints, performing "defense evasion" in order to avoid detection and inhibit root cause analysis (RCA). Keep in mind, however, that if your analysis includes a focus on developing artifact constellations rather than single artifacts taken in isolation, then the use of this technique will likely be much more evident during the course of your analysis.

Analysts may be less familiar with time stomping as it applies to Registry keys, also discussed in great detail by Lina in her blog, discussed by Maxim on X, as well as discussed by Shane McCulley and Kimberly Stone in their SANS DFIR Summit 2023 presentation. During their presentation, Kimberly discussed (mentioned several times) using the Registry transaction logs to detect Registry key time stomping by examining intermediate states of a hive file, which Maxim discussed in his blog in November, 2018. In a way, this technique is no different from examining intermediate states of the file system using the USN change journal.

All of these resources together provide a pretty thorough overview of time stomping activity; what it is, how it's achieved, etc. Lina's blog on time stomping files provides several means by which both $STANDARD_INFORMATION and $FILE_NAME attributes within an MFT record can be modified. I saw $STANDARD_INFORMATION attribute time stamps being modified quite often during the time I was engaged in PCI forensic investigations; in most cases, the time stamps were copied from kernel32.dll, so that the file dropped by the threat actor would appear to be part of normal system files.

Also during the presentation, Kimberly specifically discusses the StrozFriedberg open source library, written in Rust, for parsing offline Windows Registry hive files, named "notatin". The library includes Python bindings, and two utilities that ship as Windows binaries. Kimberly proves examples of the utilities' use during the presentation, and it's definitely a library worth looking into if you're engaged in some form of Registry parsing and analysis.

Detecting Time Stomping/Detection Methodologies
During the presentation, Kimberly mentioned several times that determining time stomping of Registry keys should be a more regular part of the analysis process, and to some extent, I agree with her. However, this perhaps requires a level of understanding of the issue, as well as automation that may not necessarily be accessible to all organizations, as they may not be set up in a manner similar to StrozFriedberg. This level of parsing and tagging/decoration of data is not something you see in commercially available forensic suites, and as such, would require a bit of developer "heavy lifting" to get the automation described by Maxim set up and enabled. This is not to say that it cannot be achieved; rather, fully exploiting the Windows Registry is not something we see in regular, normal practice, either via CTFs or via open reporting, and as such, I wouldn't think that this is something we see being part of regular processing anytime in the near future.

Another way to address the analysis issue, particularly (albeit not solely) when it comes to detecting this form of defense evasion, would to be subject the DF analysis culture to a dramatic shift, to where artifact constellations are developed and used as part of analysis on a regular basis, rather than viewing single artifacts in isolation, which appears to be more common place today.

In Lina's blog post, she provides an attack demonstration, the first two steps focusing on the Run key within the Software hive. At approximately 15:37 in the presentation video, Kimberly provides an example of the Run key within the Software hive being "time stomped". Something to consider when investigating incidents where the Run key, in either the Software or NTUSER.DAT hives, may have been time stomped, analysts should keep the Microsoft-Windows-Shell-Core%4Operational.evtx Windows Event Log file in mind; this log provides a record of when values within the Run and RunOnce keys are processed. If you subject this log to frequency of least occurrence analysis, you can determine those values that are "new" and haven't been processed but once, or even a few times, as well as get the first time they were processed. Comparing this to the full breadth of the log itself, you can determine when the value was processed for the first time. Note that this log file can also assist analysts in tracking Raspberry Robin persistence, as well.

In step 3 of the attack demonstration in her blog, Lina moved from the Run key to the Uninstall key, as this key has a number of subkeys. Not long after Lina's blog post was published, I wrote a RegRipper plugin in an attempt to implement the detection methodology, part 2; what I found was that there are a LOT of Registry keys with subkeys that have more recent LastWrite times than the key itself.

Conclusion
During my time in DFIR, I can't say that I've seen time stomping of Registry keys employed as a defense evasion technique, and so far, I haven't seen anything in public, open reporting to suggest that it has been used "in the wild". It's pretty clear from Lina's blog post that it's possible, but when conducting analysis thus far, I haven't seen any issues where the LastWrite time on the Run key, or any other key for that matter, did not align with the other artifacts within the constellation. However, to Kimberly's point, creating the necessary automation to detect the possible use of this technique, applied during the data parsing, normalization, and decoration phase, would mean that the possible used of the technique would be raised to the analyst's awareness (for further investigation) without requiring a manual examination of the data.

EndNote
Another possible means for detecting the use of this technique is to purposely configure your Windows endpoints to support this detection, by enabling the EnablePeriodicBackup value in the Registry.

Tuesday, September 19, 2023

The State of Windows Digital Analysis, pt II

On the heels of my previous blog post on this topic, I read a report that, in a lot of ways, really highlighted some of the issues I mentioned in that earlier post. The recent IDC report from Binalyze is telling, as it highlights a number of issues. One of those issues is that the average time to investigate an issue is over 26 days. As the report points out, this time could be greatly reduced through the use of automation, but I want to point out that not just any automation that is purchased from an external third party vendor is going to provide the necessary solution. Something I've seen over the years is that the single best source of intelligence comes from your own incident investigations, and what we know about our infrastructure and learn from our own investigations can help guide our needs and purchases when it comes to automation.

Further, making use of open reporting and applying indicators from those reports to your own data can be extremely valuable, although sometimes it can take considerable effort to distill actionable intelligence from open reporting. This is due to the fact that many organizations that are publishing open reports regarding incidents and threat actors do not themselves have team members who are highly capable and proficient in DF analysis; this is something we see quite often, actually. 

Before I go on, I'm simply using the post that I mention as an example. This is not a post where I'm intent on bashing anyone, or highlighting any team's structure as a negative. I fully understand that not all teams will or can have a full staffing complement; to be quite honest, it may simply not be part of their business model, nor structure. The point of this post is simply to say that when mining open reporting for valuable indicators and techniques to augment our own, we need to be sure to understand that there's a difference between what we're reading and what we're assuming. We may assume that the author of one of the reports we're reading did not observe any Registry modifications, for example, where others may have. We may reach this conclusion because we make the assumption that the team in question has access to the data, as well as someone on their team to correctly interpret and fully leverage it. However, the simple truth may be that this is not the case at all. 

So, again...this post is not to bash anyone. Instead, it's an attempt to bring awareness to where readers may fill gaps in open reporting with assumptions, and to not necessarily view some content as completely authoritative.

Consider this blog post originally published on 5 May 2022, and then most recently updated on 23 Mar 2023. I know through experience that many orgs, including ones I've worked for, will publish a blog post and then perhaps not revisit it at a later date, likely because they did not encounter any data on subsequent analyses that would lead to a modification in their findings.

Within the blog post, the section titled "Initial Access" includes the statement highlighted in figure 1.

Fig. 1: Initial Access Entry


This statement appears to (incorrectly) indicate that this activity happens automatically; however, simple testing (testing is discussed later in the post) will demonstrate that the value is created when the LNK file on the USB device is double-clicked. Or, you could look to this recent Wired.com article that talks about USB-borne malware, and includes the statement highlighted in figure 2.

Fig 2: Excerpt from Wired article


The sections on "Command and Control" and "Execution" mention the use of MSIExec, but neither one mentions that the use of MSIExec results in MsiInstaller records being written to the Application Event Log, as described in this Huntress blog post.

Figure 3 illustrates a portion of the section of the blog post that addresses "Persistence".

Fig. 3: Persistence Section


As described in this Cybereason blog post, the Raspberry Robin malware persists by writing a value to the RunOnce Registry key. When the value is read and deleted, the malware rewrites the value once it is executed, allowing the malware to persist across reboots and logins. This method of persistence is also described in this Microsoft blog post. Otherwise, the malware would simply exist until the next time the user logged in. One should also note that "Persistence" is not mentioned in the MITRE ATT&CK table in the Appendix to the blog post.

Even though the blog post was originally written and then updated at least once over the course of ten months, there's a dearth of host-based artifacts, including those from MsiExec. Posts and articles published by others, between May 2022 and Mar 2023, on the same topic could have been used to extend the original analysis, and fill in some of the gaps. Further, the blog post lists a bunch of "testing" in a section of the blog post of the same name, but doesn't illustrate host-based impacts that would have been revealed as a result of the testing. 

Just to be clear, the purpose of my comments here are not to bash anyone's work or efforts, but rather to illustrate that while open reporting can be an invaluable resource for pursuing and even automating your own analysis, the value derived from the open reporting often varies depending upon the skill sets that make up the team conducting the analysis and writing the blog, article, or report. If there is not someone on the team who is familiar with the value and nuances of the Windows Registry, this will be reflected in the report. The same is true if there is not someone on the team with more than a passing familiarity of Windows host-based artifacts (MFT, Windows Event Log, Registry, etc.); there will be gaps, as host-based impacts and persistence mechanisms are misidentified or not even mentioned. We may read these reports and use them as a structure on which to model our own investigations; doing so will simply lead to similar gaps.

However, this does not diminish the overall value of pursuing additional resources, not just to identify a wider breadth of indicators but also to get different perspectives. But this should serve as a warning, bringing awareness to the fact that there will be gaps.

With respect to host-based impacts, something else I've observed is where analysts will 'see' a lot of failed login attempts in the Security Event Log, and assume a causal relationship to the successful login(s) that are finally observed. However, using tools like Events Ripper, something I've observed more than a few times is that the failed login attempts will continue well after the successful login, and the source IP address of the successful login does not appear in the list of source IP addresses for failed login attempts. As such, there are not a flurry of failed login attempts from a specific IP address, attempted to log into a specific account, and then suddenly, a successful login for the account, from that IP address. Essentially, there is no causal relationship that has been observed on those cases.

Tuesday, September 12, 2023

The State of Windows Digital Analysis

Something that I've seen and been concerned about for some time now is the state of digital analysis, particularly when it comes to Windows systems. From open reporting to corporate blog posts and webinars, it's been pretty clear that there are gaps and cracks in the overall knowledge base when it comes to the incidents and issues being investigated. These "gaps and cracks" range from simple terminology misuse to misinterpreting single data points on which investigation findings are hung.

Consider this blog post, dated 28 April. There is not year included, but checking archive.org on 11 Sept 2023, there are only two archived instances of the page, from 9 and 15 June 2023. As such, we can assume that the blog post was published on 28 April 2023. 

The post describes ShimCache data as being "a crucial tool" for DFIR, and then goes on...twice...to describe ShimCache entries as containing "the time of execution". This is incorrect, as the time stamps within the ShimCache entries are the file system last modification times, retrieved from the $STANDARD_INFORMATION attribute in the MFT record for the file (which is easily modified via "time stomping"). The nature of the time stamp can easily be verified by developing a timeline using just the two data sources (ShimCache, MFT).

The blog post also contains other incorrect statements, such as:

Several tools are available for analyzing shimcache, including the Microsoft Sysinternals tool, sdelete...

The description of the sdelete tool, captured from the SysInternals site on 11 Sept 2023, is illustrated in figure 1.

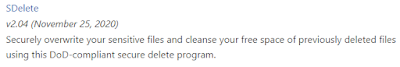
Fig. 1: Sdelete tool description


As you can see, the sdelete tool has nothing to do with "analyzing" ShimCache.

Suffice to say, there is a great deal more that is technically incorrect in the blog post, but there are two important items to note here. First, when searching Google for "shimcache", this blog post is the fourth entry on the first page of responses. Second, the blog post is from a company that offers a number of services, including digital forensics and incident response.

I'd published this blog post the day prior (27 Apr 2023), listing references that describe ShimCache entries, as well as AmCache, and their context. One of the ShimCache references, from Mandiant, from 2015, states (emphasis added):

It is important to understand there may be entries in the Shimcache that were not actually executed.

There are a number of other free resources out there that are similarly incorrect, or even more so. For example, this article was the tenth listing on the first page of results from the Google search for "shimcache". It was apparently published in 2019, and starts off by equating the ShimCache and AmCache artifacts. Further, the title of the blog post incorrectly refers to the ShimCache as providing "evidence of execution", and the browser tab title for the page is illustrated in figure 2.

Fig. 2: Browser Tab Title


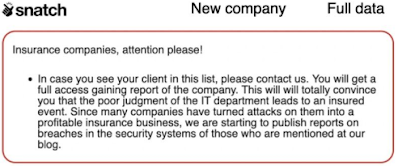
Similarly, artifact misinterpretation applies to AmCache entries. For example, this blog post that discusses Raspberry Robin includes the following statement:

...it is possible to evidence the execution of msiexec with the user's Amcache.hve artifact.

Aside from the fact that there is apparently no such thing (that I'm aware of) as "the user's Amcache.hve artifact", multiple rounds of testing (here, here) have demonstrated that, similar to ShimCache, the AmCache data source can contain references to executables that were not actually executed. This clearly demonstrates the need to cease relying on single artifacts viewed in isolation to support findings, and a need to rely upon validation via multiple data sources and artifact constellations.

I will say this, though...the blog post correctly identifies the malware infection chain, but leaves out one piece of clarifying, validating information. That is, when the msiexec command line is launched, a great place to look is the Application Event Log, specifically for MsiInstaller records, such as mentioned briefly in this Huntress blog post regarding the same malware.

These are just a couple of examples, but remember, these examples were all found on the first page of responses when Googling for "shimcache". So, if someone's attended training, and wants to "level up" and expand their knowledge, they're likely going to start searching for resources, and a good number of the resources available are sharing incorrect information. 

And the issue isn't just with these artifacts, either. Anytime we look to single artifacts or indicators in isolation from other artifacts or data sources, we're missing important context and we're failing to validate our findings. For example, while ShimCache or AmCache entries are incorrectly interpreted to illustrate evidence of execution, where are the other artifacts that should also be evident? Are there impacts of the execution on the endpoint, in the file system, Registry, or Windows Event Log? Or does the Windows Event Log indicate that the execution did not succeed at all, either due to an antivirus detection and remediation, or because the execution led to a crash?

So, What?
Why does any of this matter? Why does it matter what a DFIR blog or report says?

Well, for one, we know that the findings from DFIR engagements and reports are used to make decisions regarding the allocation (or not) of resources. Do we need more people, do we need to address our processes, or do we need another (or different) tool/product?

On 26 Aug 2022, the case of Travelers Insurance vs ICS was dismissed, with judgement in favor of Travelers. ICS had purchased a cyber insurance policy from Travelers, and as part of the process, included an MFA attestation signed by the CEO. Then, ICS was subject to a successful cyber attack, and when they submitted their claim, the DFIR report indicated that the initial means of access was via an RDP server that did not have MFA, counter to the attestation. As a result, Travelers sought, via the courts, to have the policy rescinded. And they succeeded. 

This case was mentioned here to illustrate that, yes, what's in a DFIR report is, in fact, used and relied upon by someone to make a decision. Someone looked at the report, compared the findings to the policy documentation, and made the decision to file in court to have the policy rescinded. For Travelers, the cost of filing was clearly less than the cost of paying on the policy claim. 

What about DFIR report contents, and what we've got to look forward to, out on the horizon? On 21 Aug 2023, JD Work shared this tweet, which states, in part:

Threat actors monetizing nonpayment negotiations by issuing their own authored breach reporting...

Okay, wow. Yes, "wow", and that does seem like the next logical step in the the development and growth of the ransomware economy. I mean, really...first, it was encrypt files and demand a ransom to be able to decrypt them. Then, it was, "oh, yeah, hey...we stole some sensitive data and we'll release it if you don't pay the ransom." During all of this "growth" (for want of a better term), we've seen reports in the media stating, "...sophisticated threat actor...", implying, "...there's nothing we could do in the face of overwhelming odds." So, it makes sense that the next step would be to threaten to release a report (with screen captures) that clearly demonstrated how access was achieved, which could have an affect on attestation documentation as part of the policy process, or impact the responding DFIR firm's findings.

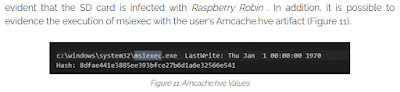
But is this something that will ever actually happen? Well, there's this LinkedIn post that contains the offering illustrated in figure 3.

Fig. 3: Snatch Ransom Note Offering


"We will give you a full access gaining report of the company". Given what Travelers encountered, what impact would such a report have on the policy itself, had the DFIR report not mentioned or described the means by which the threat actor accessed the ICS environment? Or, what impact would it have on the report issued by the DFIR firm recommended by the insurance provider?

But wait, there's more! In 2007, I was part of the IBM ISS X-Force ERS team, and we became "certified" to conduct PCI forensic investigations. At the time, we were one of 7 teams on the list of certified firms. Visa, the organization that initially ran the PCI Council, provided a structure for reporting that included a "dashboard" across the top of the report. This dashboard included several items, to include the "window of compromise", or the time between the initial infection (as determined by the forensic investigation) and when incident was addressed. This value provided a means for the PCI Council to determine fines for merchants; most merchants had an idea of how many credit cards they processed on a regular basis, even adjusted for holidays. As such, the "window of compromise" could be used as an indicator of how many credit card numbers were potentially at risk as a result of the breach, and help guide the Council when assessing a fine against the merchant.

In 2015, an analyst was speaking at a conference, describing a PCI forensic investigation they'd conducted in early summer, 2013. When determining the "window of compromise", they stated that they'd relied solely on the ShimCache entry for the malware, which they'd (mis)interpreted to mean, "time of execution". What they hadn't done was parse the MFT, and see if there was an indication that the file had been "time stomped" ($STANDARD_INFORMATION attribute time stamps modified) when it was placed on the system, which was something we were seeing pretty regularly at the time. As a result, the "window of compromise" was determined (and reported) to be 4 yrs, rather than 3 weeks, all because the analyst had relied on a single artifact, in isolation, particularly one that they'd misinterpreted.

Breakin' It Down
The fundamental issues here are that (a) analysts are not thinking in terms of validating findings through the use of multiple data sources and artifact constellations, and (b) that accountability is extremely limited.

Let's start with that first one...what we see a good bit of in open reporting is analysts relying on a single artifact, in isolation and very often misinterpreted, to support their findings. From above, refer back to this blog post, which includes the statement shown in figure 4.

Fig. 4: Blog statement regarding evidence of execution


First, as I've tried to illustrate through this post, this artifact is regularly misinterpreted, as are others. Further, it is clearly an artifact viewed in isolation; when msiexec commands are run, we would expect to find MsiInstaller records in the Application Event Log, so there are corroborating artifacts within the constellation. These can be very useful in identifying the start of the installation attempt, as well as the success or failure of the installation, as was observed in this Raspberry Robin blog post from Huntress.

With respect to "accountability", what does this mean? When a DFIR consulting firm responds to an incident, who reviews the work, and in particular, the final work product? A manager? I'm not a fan of "peer" reviews because what you want is for your work to be reviewed by someone with more knowledge and experience than you, no someone who's on the same level.

Once the final product (report, briefing, whatevs) is shared with the customer, do they question it? In many cases I've seen, no, they don't. After all, they're relying on the analyst to be the "expert". I've been in the info- and cyber-security industry for 26 yrs, and in that time, I've known of one analyst who was asked by two different customers to review reports from other firms. That's it. I'm not saying that's across the hundreds of cases I've worked, but rather across the thousands of cases worked across all of the analysts, at all of those places where I've been employed.

The overall point is this...forensic analysis is not about guessing. If you're basing your findings on a single artifact, in isolation from everything else that's available, then you're guessing. Someone...whomever is receiving your findings...needs correct information on which to base their decisions, and from which they're going to allocate resources...or not, as the case may be. If the information that analysts are using to keep themselves informed and up-to-date is incorrect, or it's not correctly understood, then this all has a snowball effect, building through they collection, parsing, and analysis phases of the investigation, ultimately crashing on the customer with the analyst's report.

Addendum
I ran across this tweet from @DFS_JasonJ recently, and what Jason stated in his tweet struck a chord with me. The original tweet that Jason references states that it's "painful to watch" the cross examination...I have to agree, I didn't last 90 seconds (the video is over 4 min and 30 seconds long). Looking through more of his tweets, it's easy to see that Jason has seen other issues with folks "dabbling" in DF work; while he considers this "dangerous" in light of the impact it has (and I agree), I have to say that if the findings are going to be used for something important, then it's incumbent upon the person who's using those results to seek out someone qualified. I've seen legal cases crumble and dissolve because the part-time IT guy was "hired" to do the work.

Further, as Red Canary recently pointed out, the SEC is now requiring organizations to "show their work"; how soon before that includes specifics of investigations in response to those "material" breaches? Not just "what was the root cause?", but also, "...show your work...".

Addendum, 17 Sept:
Something I've seen throughout my time in the industry is that we share hypotheticals that eventually become realities. In this case, it became a reality pretty quickly...following publication of the ransomware attack against MGM, someone apparently from the ALPHV group shared a statement clarifying how they went about the attack. Of course, always take such things with a grain of salt, but there you have it, folks...it's already started.

On a side note, Caeser's was also attacked, apparently be the same group, and paid the ransom.

Monday, August 28, 2023

Book Review: Effective Threat Investigation for SOC Analysts

I recently had an opportunity to review the book, Effective Threat Investigation for SOC Analysts, by
Mostafa Yahia. 

Before I start off with my review of this book, I wanted to share a little bit about my background and perspective. I started my grown-up "career" in 1989 after completing college. I had a "technical" (at the time) role in the military, as a Communications Officer. After earning an MSEE degree, I left active duty and started consulting in the private sector...this is to say that I did not stay with government work. I started off by leading teams conducting vulnerability assessments, and then over 22 yrs ago, moved over to DFIR work, exclusively. Since then, I've done FTE and consulting work, I ran a SOC, and I've written 9 books of my own, all on the topic of digital forensic analysis of Windows systems. Hopefully, this will give you some idea of my "aperture".

My primary focus during my review of Mostafa's book was on parts 1, 2, and 4, as based on my experience I am more familiar with the material covered in part 2. My review covers about 7 of the 15 listed chapters, not because I didn't read them, but because I wanted to focus more on areas where I could best contribute.

That being said, this book serves as a good introduction to materials and general information for those looking to transition to being a SOC analyst, or those newly-minted SOC analysts, quite literally in their first month or so. The book addresses some of the data sources that a SOC analyst might expect to encounter, although in my experience, this may not always be the case. However, the familiarization is there, with Mostafa demonstrating examples of each data source, and how to use them, addressed in the book.

I would hesitate to use the term "effective" in the title of the book, as most of what's provided in the text is introductory material, and should be considered intended for familiarization, as it does not lay the groundwork for what I would consider "effective" investigations.

Some recommendations, specifically regarding the book:
Be consistent in terminology; refer to the Security Event Log as the "Security Event Log", rather than as "Security log file", the "security event log file", etc. 

Be clear about what settings are required for various records and fields within those records to be populated. 

Take more care in the accuracy of statements. For example, figure 6.5 is captioned "PSReadline file content", but the name of the file is "consolehost_history.txt". Figure 7.1 illustrates that Run key found within the Software hive, but the following text of the book incorrectly states that the malware value is "executed upon user login".

Some recommendations, in general:
Windows event IDs are not unique; as such, records should be referred to by their source/ID pair, rather than solely by event ID. While the Microsoft-Windows-Security-Auditing/4624 event refers to a successful login, the EventSystem/4624 event refers to something completely different. 

What's logged to the Security Event Log is heavily dependent upon the audit configuration, which is accessible via Group Policies, the Local Security Editor, or auditpol.exe. As such, many of the Security Event Log event IDs described may not be available on the systems being examined. Just this year (2023), I've examined systems where successful login events were not recorded.

Analysts should not view artifacts (in this case, Windows Event Log records, Run key values, etc.) in isolation. Instead, viewing artifacts or data sources together, based on time stamps (i.e., timelining) from the beginning of an investigation, rather than manually developing a timeline in a spreadsheet at the end of an investigation, is a much more efficient, comprehensive, and effective process.

Multiple data sources, including multiple Windows Event Logs, can provide insight into various activities, such as user logins, etc. Do not focus on a single artifact, such as an event ID, but instead look to develop artifact constellations. For example, with respect to user logins, looking to the Security Event Log can prove fruitful, as can the LocalSessionManager/Operational, User Profile Service, Shell-Core/Operational, and TaskScheduler Event Logs. Developing a timeline at the beginning of the investigation is a great process for developing, observing, and documenting those constellations.

Sunday, August 27, 2023

The Next Step: Integrating Yara with RegRipper, pt II

Okay, so we've integrated Yara into the RegRipper workflow, and created "YARR"...now what? The capability is great...at least, I think so. The next step (in the vein of the series) is really leveraging it by creating rules that allow analysts to realize this capability to it's full potential. To take advantage of this, we need to consider the types of data that might be present, and leverage what may already be available and apply to the use case (data written to Registry values) at hand.

Use Available Rules
A great place to start is by using what is already available, and applying those to our use case; however, not everything will apply. For example, using a Yara rule for something that's never had any indication that it's been written to a Registry value likely won't make a great deal of sense to use, at least not at first. That doesn't mean that something about the rule won't be useful; I'm simply saying that it might make better sense to start by looking at what's being written to Registry values first, and start there.

It certainly makes sense to use what's already available as a basis for building out your rule set to run against Registry values. Some of the things I've been looking around for, to see what's already out there and available, are looking for indications of PE files within Registry values, using different techniques and not relying solely on the data beginning with "MZ"; encoded data; strings that include "http://" or "https://"; etc. From these more general cases, we can start to build a corpus of what we're seeing, and begin excluding those things that we determine to be "normal", and highlighting those things we find to be "suspicious" or "bad".

Writing Rules
Next, we can write our own rules, or modify existing ones, based on what we're seeing in our own case work. After all, this was the intention behind RegRipper in the first place, that analysts would see the value in such a tool, not just as something to run but as something to grow and evolve, to add to and develop.

For writing your own rules, there are loads and loads of resources available, one of the most recent from Hexacorn, with his thoughts on writing better Yara rules in 2023. Also be sure to check out Florian's style guide, as well as any number of repositories you can find via Google.

Speaking of Florian, did you know that Thor already has rules for Registry detection? Very cool!

What To Look For
Okay, writing RegRipper plugins and Yara rules is a bit like detection engineering. Sometimes you have to realize that you won't be able to write the perfect rule or detection, and that it's best to write several detections, starting with a "brittle" detection that, at first glance, is trivial to avoid. I get it..."...a good hacker will change what they do the next time...". Sure. But do you know how many times I've seen encoded Powershell used to run lsassy? The only thing that's changed is output file names; most of the actual command doesn't change, making it really easy to recognize. Being associated with SOCs for some time now, and working DFIR investigations as a result, there are a lot of things we see repeatedly, likely due to large campaigns, tool reuse, etc. So there is value in a brittle detection, particularly given the fact that it's really easy to write (and document), usually taking no more than a few seconds, and if we leverage automation in our processes, it's not something we have to remember to do.

So, What?
Why is adding Yara capability to RegRipper important or valuable?

The simple fact is that processes are created, executed, and measured by people. As such, they will break or fail.

In 1991, AFOSI was investigating one of their own in the death of his wife. During an interrogation, floppy disks collected from the Sgt's home were placed on the table, and he grabbed some of them and cut them up with shears. This story is usually shared to demonstrate the service's capability to recover data, even when the disk is cut up, which is exactly what was done in this case. However, over the years, few have questioned how the Sgt was able to get the shears into the interrogation room; after all, wouldn't he have been patted down at least once?

The point is that processes (frisking, checking for hidden weapons) is a process created, executed, and managed/measured by people, and as a result, things will be missed, steps skipped, things will go unchecked. So, by incorporating this capability into RegRipper, we're providing something that many may assume was already done at another point or level, but may have been missed. For example, the findexes.pl plugin looks for Registry values that start with "MZ", but what if the value is a binary data type (instead of a string), and the first two bytes are "4D 5A" instead? Yara provides a fascinating (if, in some cases, overlapping) capability that, when brought to bear against Registry value data, can be very powerful. With one rule file, you can effectively look for executables (in general), specific executables or shell code, encoded data, etc.

Tuesday, August 22, 2023

Yet Another Glitch In The Matrix

It's about that time again, isn't it? It's been a while since we've had a significant (or, depending upon your perspective, radical) shift in the cyber crime eco-system, so maybe we're due. 

What am I referring to? Back in 2019, we saw a shift in ransomware attacks, where threat actors began not only stealing data, but leveraging it as "double extortion". Up to that point, the "plan" had been to encrypt files, maybe post something publicly to let the world know that this organization had been impacted by your efforts, and hope to collect a ransom. The shift to "double extortion" moved things to a whole new level, and while there's some discussion as to whether this started in November 2019 with Maze, or if it actually started sooner...some have anecdotal information but cannot point to any public statement to the effect...the fact remains that the game shifted. In the ensuing four years, we've seen quite a bit of damaging information released, and maybe none was more disturbing than what was discussed in the ransomware attack against Minnesota Public Schools, in Feb, 2023. The school system refused to pay the ransom, and the stolen data was released publicly...a brief reading of what was in the dump gives you a brief look into the devastation caused by the release of this data.

Something else to consider is the impact of the insurance industry on the cyber security market, a topic that was covered extensively by Woods, et al, at Usenix. The insurance industry itself has, in recent years, started pulling back from the initial surge of issuing policies to developing more stringent requirements and attestations that impact the premium and policy coverage.

So, what?
Okay, so, what? Who cares? Well, here's the change, from @HostileSpectrum:

Threat actors monetizing nonpayment negotiations by issuing their own authored breach reporting...

Yes, and that's exactly what it sounds like. Not convinced? Check out this LinkedIn post from Dr. Siegfried Rasthofer, regarding the Snatch ransomware actors; "...contact us...you will get a full access gaining report...".

I know what you're thinking...so, what? Who cares? The org files a claim with their insurance provider, the provider recommends a DFIR firm, that DFIR firm issues their report and it'll just say that same thing, right?

Will it?

What happens if counsel tells the DFIR firm, "...no notes, no report..."? RootkitRanger gets it, sees the writing on the wall, as it were. No notes, no report, then how is the DFIR analyst held accountable for their work?

Why is this important? 

For one, there are insurance provider war exclusions, and they can have a significant impact on organizations. Merck filed their $1.4B (yes, "billion") claim following the 2017 NotPetya attack, and the judgement wasn't decided until May, 2023, almost 6 yrs later. What happens when attribution based on the DFIR firm's work and the decision made by counsel goes on way, and the threat actor's report goes another?

We also need to consider what happens when attestations submitted as part of the process of obtaining a policy turn out to be incorrect. After all, Travelers was able to rescind a policy after a successful attack against one of their policy holders. So, in addition to having to clean up and recover, ICS did not have their policy/safety net to fall back on. Let's say the threat actor says, "...we purchased access from a broker, and accessed an RDP server with no MFA...", and the org, like ICS, had attestations stating that MFA was in place?

Sunday, August 13, 2023

Integrating Yara with RegRipper

A lot of writing and training within DFIR about the Registry refers to it as a database where configuration settings and information is maintained. There's really a great deal of value in that, and there is also so much more in the Registry than just "configuration information". Another aspect of the Registry, one we see when discussing "fileless" malware, is its use as a storage facility. As Prevailion stated in their DarkWatchman write-up:

Various parts of DarkWatchman, including configuration strings and the keylogger itself, are stored in the registry to avoid writing to disk.

The important part of that statement is that the Registry is and can be used for storage. Yes, you can store configuration settings, as well as information that can be used to track user activity, connected devices, connected networks, etc., but the Registry can just as easily be used to store other information, as well. As we can see from the Fileless Storage page (part of the MITRE ATT&CK framework) there are quite a few examples of malware that use the Registry for storage. In some cases, the keys and values are specific to the malware, whereas in other instances, the storage location within the hive file itself may change depending upon the variant, or even selections made through a builder. Or, as with Qakbot, the data used by the malware is stored in values beneath a randomly-named key.

As such, it makes sense leverage Yara, which is great for detecting a wide range of malware, via RegRipper. One way to find indications of malware that writes to the Registry, specifically storing its configuration information, is by creating a timeline and looking for keys being added or updated during the time of the presumed compromise. Another is to comb through the Registry, looking for indications of malware, shell code, encoded commands, etc., embedded within values, and this is where leveraging Yara can really prove to be powerful.

One example would be to look for either the string "MZ" or the bytes "4D 5A" at offset 0. If malware is stored in the Registry with those bytes stripped, then searching for other strings (PDB strings) or sequences of bytes would be an effective approach, and this is something at which Yara excels. As such, leveraging Yara to extend RegRipper makes a great deal of sense.

Maybe we can call this "YARR", in honor of International Talk Like A Pirate Day.

Saturday, August 12, 2023

The Next Step: Expanding RegRipper

I thought I'd continue The Next Step series of blog posts with something a little different. This "The Next Step" blog post is about taking a tool such as RegRipper to "the next step", which is something I started doing in August, 2020. At first, I added MITRE ATT&CK mapping and Analysis Tips, to provide information as to why the plugin was written, and what an analyst should look for in the plugin output. The Analysis Tips also served as a good way of displaying reference URLs, on which the plugin may have been based. While the reference URLs are very often included in the header of the plugin itself, it's often simply much easier to have them available in the output of the plugin, so that they follow along and are available with the data and the case itself. 

So, in the spirit of the blog series, here are a couple of "the next steps" for RegRipper...

JSON
Something I've looked at doing is creating plugins that provide JSON-formatted output. This was something a friend asked for, and more importantly, was willing to discuss. When he asked about the format, my concern was that I would not be able to develop a consistent output format across all plugins, but during the discussion, he made it clear that that wasn't necessary. I was concerned about a consistent, normalized format, and he said that as long as it was JSON format, he could run his searches across the data. I figured, "okay, then", and gave it a shot. I started with the appcompatcache.pl plugin, as it meant just a little bit of code that repeated the process over and over again...an easy win. From there, I modifying the run.pl plugin, as well.

An excerpt of sample output from the appcompatcache_json.pl plugin, run against the System hive from the BSides Amman image appears as follows:

    {
       "value": "C:\Users\Joker\DCode.exe"
       "data": "2019-02-15 04:59:23"

    },

    {
       "value": "C:\Windows\SysWOW64\OneDriveSetup.exe"
       "data": "2018-04-11 23:34:02"

    },
   ]
}

So, pretty straightforward. Now, it's a process of expanding to other plugins, and having the ability with the tool itself to select those plugin output types the analyst is most interested in.

Yara
Something else I've looked at recently is adding the ability to incorporate Yara into RegRipper. While I was at Nuix, I worked with David Berry's developers to get some pretty cool extensions added to the product; one for RegRipper, and one for Yara. I then thought to myself, why not incorporate Yara into RegRipper in some manner? After all, doing things like detecting malware embedded in value data might be something folks wanted to do; I'm sure that there are a number of use cases.

Rather than integrating Yara into RegRipper, I thought, why re-invent the wheel when I can just access Yara as an external application? I could take a similar approach as to the one used by the Nuix extensions, and run Yara rules against value data. And, it wouldn't have to be all value, as some types won't hold base64-encoded data. In other instances, I may only want to look at binary data, such as searching for payloads, executables, etc. Given that there are already plugins that recursively run through a hive file looking at values and separating the actions taken based on data type, it should be pretty easy to gin up a proof of concept.

And, as it turns out, it was. I used the run.pl plugin as a basis, and instead of just displaying the data for each value, I ran some simple Yara rules against the contents. One of the rules in the rule file appears as follows:

rule Test3
{
    strings:
        $str1 = "onedrive" nocase
        $str2 = "vmware" nocase

    condition:
        $str1 or $str2
}

Again, very simple, very straightforward, and simply designed to produce some output, nothing more.

The output from the plugin appears as follows:

Run_yara.pl output


Now, I'll admit up front...this is just a proof of concept. However, it illustrates the viability of this technique. Now, using something like the sizes.pl plugin, I can remove the code that determines the number of values beneath a key, and focus on just scanning the value data...all of it. Or, I can have other plugins, such as clsid.pl, comb through a specific key path, looking for payloads, base64-encoded data, etc. Why re-write the code when there are Yara rules available that do such a great job, and the rules themselves may already be part of the analyst's kit.

Techniques like this are pretty powerful, particularly when faced with threat actor TTPs, such as those described by Prevalion in their DarkWatchman write-up

Various parts of DarkWatchman, including configuration strings and the keylogger itself, are stored in the registry to avoid writing to disk.

So, with things like configuration strings and an entire keylogger written to the Registry, there are surely various ways to go about detecting the presence of these items, including key LastWrite times, the size of value data, and now, the use of Yara to examine data contents.

As with the JSON output plugins, now it's simply a matter of building out the capability, in a reasonable fashion. 

Monday, August 07, 2023

Ransomware Attack Timeline

The morning of 1 Aug, I found an article in my feed about a ransomware attack against a municipality; specifically, Montclair Township in New Jersey. Ransomware attacks against municipalities are not new, and they can be pretty devastating to staff and citizenry, as well, and this is even before a ransom is paid. Services are impacted or halted, and I've even seen reports where folks lost considerable amounts of money because they weren't able to get the necessary documentation to process the purchase of a home.

I decided to dig a bit and see what other information I could find regarding the issue, and the earliest mention I could find was this page from 6 June 2023 that includes a link to a video message from the mayor, informing everyone of a "cyber incident". I also found this article from North Jersey dot com, reporting on the mayor's message. Two days later, this article from The Record goes into a bit more detail, including a mention that the issue was not related to the MOVEit vulnerability.

At this point, it looks as if the incident occurred on 5 June 2023. As anyone who's investigated a ransomware attack likely knows, the fact that files were encrypted on 5 June likely means that the threat actor was inside the environment well prior to that...2 days, 2 weeks, 2 months. Who knows. If access was purchased from an IAB, it could be completely variable, and as time passes and artifacts oxidize and decay, as the system just goes about operating, it can become harder and harder to determine that initial access point in time. 

What caught my attention on 28 July was this article from Montclair Local News stating that had a bit of a twist on the terminology used in such incidents; rather, should I say, another twist. Yes, these are referred to many times as a "cyber incident" or "cyber attack" without specifically identifying it as ransomware, and in this instance, there's this quote from the article (emphasis added):

To end a cyber attack on the Montclair Township’s IT Department, the township’s insurer negotiated a settlement of $450,000 with the attackers.

It's not often that a ransom paid is referred to as a settlement, at least not in articles I've read. I can't claim to have seen all articles associated with such "cyber attacks", but at the same time, I haven't seen this turn of phrase to refer to the ransom payment.

Shortly after the above statement, the article goes on to say:

Some data belonging to individual users remains to be recovered...

Ah, yes...a lot of times you'll see folks say, "...don't trust the bad guy...", because there's no guarantee that even paying for the decryptor that you'll get all of your data back. This statement would lead us to believe that this is one of those instances.

Another quote from the article:

To guard against future incidents, the township has installed the most sophisticated dual authentication system available to its own system and it is currently up and running.

Does this say something about the attack? Does this indicate that the overall issue, the initial infection vector, was thought to be some means of remote access that was not protected via MFA?

Something else this says about the issue - 5 June to 28 July is almost 8 full weeks. Let's be conservative here and assume that the reporting on 28 July is not up-to-the-minute, and say that the overall time between encrypted files and ransom (or "settlement") paid is 7 weeks; that's still a long time to be down, not being able to operate a business or a government, and this doesn't even address the impacted services, and the effect upon the community.

I know that one article mentions a "settlement" or what's more commonly known as a ransom payment, but where does that money really come from?

Municipalities (local governments, police departments, etc.) getting ransomed is nothing new. Newark was hit with ransomware in April 2017; yes, that was 6 yrs ago, multiple lifetimes in Internet years, but shouldn't that have served as a warning?