Saturday, March 01, 2014

Reconstructing Data Structures

I've posted before on the topic of understanding data structures (here, here, and here), and some recent analysis brought this back to me yet again.  I had an opportunity to make use of my understanding of data structures, specifically within the Windows Registry, in order to attempt to gain some information from a file where the tools normally used by analysts had failed.

The situation was that we had a Windows system that had been compromised...the bad guy had accessed the system using stolen credentials, then used it to move laterally to other systems.  Between this and the response activities, the system had been infected with malware that overwrites and deletes files.  A responder had collected potentially usable files from this system, including the Registry hives from the compromised user account, and had then run some Registry parsing tools against the hives, none of which worked.  Yep.  All of the tools failed...even the viewers.

I was sent a Registry hive file and a list of "strings of interest", and asked to provide some context to those strings, and if possible, when those strings had been created within the hive file.  My first step was to get an idea as to why the tools used to view and parse the hive had reportedly failed...so, I opened the file in a hex editor.

The first thing I noticed was that there was no 'regf' header.  In Windows Registry hive files, the first four bytes of the file should read "regf" (or "72 65 67 66" in hexadecimal)...there was no header.  Next, I looked for the first 'hbin' section, which is usually found at offset 0x1000 within the file, and starts with 'hbin'.  In this case, I didn't find an 'hbin' section until I reached offset 0x10000 in the file...and the entire space up to that point was all zeros.  I could tell right away that this wasn't good.  Even worse, when I was finally able to locate a key node structure within the hive file, it wasn't the root node.  In fairly short order, it was easy to see why all of the parsing tools had failed, as none had been able to discern a recognizable file structure.

Each hbin section is 4096 (0x1000) bytes in size, which means that if the first hbin section was located at offset 0x10000 within the file, I was missing over a dozen complete hbin sections.  Not a great way to get started, eh?  As I scrolled through the rest of the file quickly, I could see what looked like legitimate key and value nodes, but I could also see other sections  of the file...large sections...that were full of zeros, as well as some that were full of binary stuff that made no sense whatsoever.  In some cases, I could see sections that contained what appeared be Unicode strings, but there were no discernible structures surrounding those strings.

When I was reading over this article prior to posting it, I tried to imagine that last paragraph as scary as possible, just for effect. I pictured myself reading this out loud like a scout leader telling a bunch of scouts a ghost story around a campfire, or huddled under a blanket with a flashlight. I don't know if that helps get the point across about how badly damaged this file was, or if it was just funny.   I mean, for me, saying, "...the first hbin in the hive file was found at offset 0x10000..." IS a horror story!  Either way, in attempting to provide anything at all, I had my work cut out for me...this was going to be tough.

Some background about myself...I was "trained" as an electrical engineer; that is, my undergraduate studies were in EE.  One of my professors would constantly say that "electrical engineers are inherently lazy", meaning that rather than making a complicated solution, or worse, making wild, unsupported assumptions about what we were looking at, electrical engineers would always seek the simplest solution. He even told us a story once about how a radar system used across the Air Force had been "fixed" by soldering a resistor in parallel to another resistor on a circuit board, rather than replace the entire circuit board.  Seeking a simple solution, I thought it best to seek out some reference material for help.  My reference for this work was/is Windows Registry Forensics; in this case, the lower half of pg 26 (in the soft cover edition).

By now I pretty much knew that I had my work cut out for me.  I had a list of strings of interest, but just the strings.  If I was going to make any sense of these strings at all, I'd have to know where they were located within the file.  So, I ran MS/SysInternals strings.exe with the -o switch, so that I could get the offset of the where the string was located within the file.  Once I had done that, I noted a couple of the strings of interest, and opened the hive file in a hex editor.  I picked one of the strings...the output of strings gives me the offset in decimal, so I converted the offset to hexidecimal...and located it in the file.  I did this with several of the strings, and in each case, my findings fell into one of three categories:

1.  The string was a value name.
Pp. 29 - 31 of WRF cover the structure of a Registry value.  The value node header is 20 bytes long, and starts with a 4-byte (DWORD) value that is the size of the overall structure itself (i.e., the header and the name).  An example value is illustrated in figure 1.

Fig 1: Registry value structure
In figure 1, the value header starts 8 bytes into the listing, with "D8 FF FF FF".  This value translates to -40, and tells us that the structure is 40 bytes in size.  Next, we see "vk", which is the value node identifier.  The next two bytes, "10 00", tell us that the name of the value is 16 bytes long.  The name starts immediately following the value structure, so there is no offset to the name listed in the value header; in this case, we can see the name, "GroupByDirection", which is clearly 16 bytes in size.

The remaining elements of the value header can be found in table 1.2 in WRF.  The value types can be found in table 1.3.

2.  The string was the name of a deleted value.
In several instances, I located the string in question and following the structure of a 'nearby' value, found that the string was indeed the value name.  However, when a node (key, value) is deleted in a Registry hive file, the size value (first DWORD) is converted to a positive number.

Consider figure 1 again...the first DWORD is "D8 FF FF FF", which is equal to -40.  Had the value been deleted, the DWORD would be "28 00 00 00".

3.  The string was value data.
In some cases, I found strings at offsets where there was no 'nearby' value (vk) or key (nk) node.   Instead, immediately before the string was what appeared to be a DWORD indicating a negative size value.  In figure 2, the value is '88 FF FF FF'.

Fig 2: Value Data

The string illustrated in figure 2 is an excerpt of a value data entry that I extracted from one of my own systems, but it illustrates the point very well.  In this case, the first DWORD translates to -120, indicating that the string value is 120 bytes in length.  Again, figure 2 illustrates an excerpt of the Registry value data, not the entire string.

Just to be clear, I wasn't looking for all available strings, and I also did not look at all of the strings of interest. By this point, I had looked at about a dozen of so of the strings of interest, out of several dozen.  I mention this because some of the strings of interest could have been key names, but at this point, none of the strings I'd looked at were, in fact, key names.  I should mention that some of the strings appeared as Unicode strings in those sections of the file that I mentioned earlier in this post...while the string was clearly visible, and of interest in the context of the overall examination, I could not find any discernible structure (Registry key or value node, shell item, etc.) near or surrounding the string.

Now, the Windows Registry is described as a hierarchical database, but it's also something of a singly-linked list of structures.   What I mean by this is that the root key node in a Registry hive file points to other keys (subkeys) and values.  Subkeys point to other keys and values, and values only point to data.  When I say "point to", I'm referring to the offset within the value or key header structure that tells us where the next element is located.  This offset is not measured from the beginning of the file (from 0); rather, it starts at the beginning of the first hbin structure, which is (usually) at offset 0x1000.  Let's say that you find an offset value within a value header structure that points to the data, and the offset is "D8 54 01 00".  Translating endianness, we would look for that data structure at 0x0154D8 + 0x1000 within the hive file, or at offset 0x0164D8 from the beginning of the file.

Because key nodes point to other other key nodes and value nodes, and value nodes point to data, the Registry can be described as a singly-linked list.  By contrast, active processes in memory are maintained as a doubly-linked list...each process points to the next process in the list, as well as the previous process in the list.  In the Registry, a value does not point to it's parent key, nor do keys point to their parent key.  This can make it difficult to reconstruct a damaged Registry hive file, particularly when strings of interest that may be pertinent to the investigation can be seen within the file.

In the instance I was looking at, just scrolling through the hive file, I could see that a good deal of it had been destroyed.  In fact, it looked as if the virus had successfully overwritten entire sectors with zeros, and in other some cases, some of the sectors that made up the rest of the file I was sent did not even contain discernible structures.  I knew that I couldn't start at the beginning of the file and reconstruct the hive file...too much was missing.  One approach might have been to comb through the file and catalog all of the key and value node structures that I could locate (both allocated and unallocated), and then run consecutive scans to (a) locate associated value data, and (b) correlate the values to the appropriate keys.

What I did instead was pick out a couple of the more interesting strings, and locate them within the hive file.  I had the offset to the string from the strings.exe output, so I went to that offset in the file, found the string, and then found the beginning of the structure, of which the string was a member.  I noted the structure type (value, data) and recorded the offset for the structure.  I then subtracted 0x1000 from the offset, reversed the endianness, and searched for the value in the hive file.

Here's an example...in one instance, I located a string that was a value name, and the value structure began at offset 0x164D8 within the file.  Subtracting 0x1000, I got 0x154D8, and reversing endianness, I got "D8 54 01 00".  I then searched for that hex string in UltraEdit.  What that led to was a structure that maintained a list of offsets to values associated with a key.  So, I repeated this process, using the location where this structure started.  What that led me to discover was that the key had been obliterated from hive; it wasn't "deleted" in the sense that the first DWORD had been converted to a positive value...it simply no longer existed in the file.

As laborious as it is, this process can be used to gain some modicum of context and value for the investigator.

Process
When confronted with a hive file as badly damaged as the one I was looking at, there are basically two ways to go about collecting some modicum of information and context from the file.  The first is to comb through the entire file, cataloging each discernible structure, as if you were putting puzzle pieces out on a table.  Each structure would have to include not just the information it contained, but also the offset to where it was located within the file.  Once the scanning process had been completed, the pieces could be assembled much like a puzzle, albeit with a lot of missing pieces.

The other way to go about this would be to do something like what I did...find a string of interest, locate it within the file, determine what type of structure it belonged to (if it was part of a structure...), and attempt to reconstruct the path based on knowledge of the structures.  I opted for this approach because it gave me some answers quickly.

Take-away
My biggest take away from this exercise was that understanding the structure of what I was looking at allowed me to not only troubleshoot the issue and determine why the tools weren't working, but it also allowed me to provide some information, context, and insight regarding the data when those tools were not able to do so.

Final Thought
One of the comments to one of my previous posts on this topic included the following question:

Another question might be: With all the data structures out there, is it even possible to truly understand them all?

I would suggest that, no, it's not possible for any single analyst to understand all of the structures available on a Windows system.  That's why none of us try to do so...instead, some of us document what we know, in books or by posting to a wiki, and then offer ourselves as resources.  That way, if someone has a question, all they have to do is ask.  So, if an analyst runs across something that they don't understand, they can continue to not understand it, or they can ask someone who appears to know something about the topic, and in fairly short order, get an understanding.

Monday, February 17, 2014

More Tracking User Activity via the Registry

I have previously posted on the topic of determining a user's access to files, and thanks to Jason Hale's recent post on a similar topic (i.e., MS Word 2013 Reading Locations), I got interested in the topic again.  I was interested in seeing if there were any similar artifacts available for other MS Office apps, such as PowerPoint or Excel.  I exchanged a couple of emails with Jason, and ran a somewhat simple, atomic test  to see what artifacts might be available.  Jason took a different approach to testing than I did...he used ProcMon on a live system, whereas I ran my test, pulled the pertinent hive files off of the system and created a timeline.

Based on Jason's testing with MS Word, I wanted to see if a user were to open a PowerPoint presentation, get partway through it and close the application, would PowerPoint make some record of which slide was last in focus when the app was closed.  Jason ran a test or two of his own, and shared with me that he found some very interesting information beneath the following key:

HKCU\Software\Microsoft\Office\15.0\Common\Roaming\Identities\Anonymous\Settings\1076\{00000000-0000-0000-0000-000000000000}\PendingChanges\

I ran my own tests, using MS Office 2013 installed on Windows 8.1.  I plugged in a thumb drive (mounted as G:\) and double-clicked a PPTX file in the root of that volume (file named "shell items.pptx").  Once the presentation was open, I clicked on the third slide, and then closed the application, launched FTK Imager on the system, copied off the NTUSER.DAT and USRCLASS.DAT hives for the user account, and shut the system down.  I moved the thumb drive to my analysis system and created a timeline of the key LastWrite times from the hives...only to find that changes hadn't been written to the hives.  So, I booted the Win8.1 system again, copied off the hives again, and repeated the process, and was able to see what I was looking for.

First, I had used my Live ID account when logging into the system, so the path to the PendingChanges subkeys was a bit different from what Jason found:

HCKU/Software/Microsoft/Office/15.0/Common/Roaming/Identities/c4d2c8d78e44cf84_LiveId/Settings/1076/{00000000-0000-0000-0000-000000000000}/PendingChanges/dafbbe5e/22434

Beneath this key are several values, including one named "ItemData" that appears to contain XML-like contents, in Unicode format, in the binary value data.  Another value, "LastModified", has data that appears to be a SystemTime structure.

I had incorporated details from the UserAssist data from the hive into the timeline, and as such, I could see in the timeline where that data marked the start of the artifacts I had hoped to see.  For example, within the same second in the timeline, I could see the UserAssist data illustrating that PowerPoint had been launched, as well as an entry beneath the RecentDocs\.pptx key being created, pointing to the file "shell items.pptx".

I also found values beneath the HCKU/Software/Microsoft/Office/15.0/PowerPoint/User MRU/LiveId_blah/File MRU and Place MRU keys that were very useful.  Specifically, both keys had values named "Item 1" with data that pointed to the resource in question.  For the File MRU key, the "Item 1" value data was:

[F00000000][T01CF2BE8F8E1FA40][O00000000]*G:\shell items.pptx

The Place MRU "Item 1" value data was similar, but only pointed to "G:\".  Notice the "T" value in the brackets...that's a FileTime structure that correlates to the time of the access to the file...in this case, 17 Feb 2014 at approx. 14:03:02 UTC.

A couple of things to note at this point:

1.  This really illustrates what I've been saying for some time; that as the versions of Windows have increased over the years, more information is being recorded and maintained with respect to user activity, particularly within the Registry.  These artifacts are based solely on the Registry; the file system is likely to have additional artifacts, such as Jump Lists, that can provide even more context and visibility into user activity.

2.  This was an atomic test...I performed one action and collected data to see what changes occurred.  We all know that DFIR work never occurs this way; in fact, most often, we may not get access to the data for weeks or months after the activity in question occurred.  As such, you should not expect the artifacts to appear exactly as described in this post.

3.  The available findings are based on extremely limited testing and data; more testing and data means better results.

Monday, January 20, 2014

Book Review: Cloud Storage Forensics


I had an opportunity to review Cloud Storage Forensics recently, and I wanted to provide my thoughts on the contents of the book.  I generally don't find book reviews that read like a table of contents (i.e., "...chapter 1 covers...ch 2 covers...") entirely useful, and I'm not sure that others would find them useful, either.  As such, I'm going to approach my review in a different manner.

The book addresses digital forensic analysis of client systems used to connect to and make use of several "cloud storage providers".  This is important to point out, as the terms 'cloud' and 'cloud storage' can so often be misunderstood.  Some may think, for example, that this may have to do with those services available through Amazon Web Services.

The book primarily addresses three cloud storage providers...SkyDrive, Dropbox, and Google Drive...each accessed from a Windows 7 PC and an Apple iPhone 3G.  In both instances, access to the storage facilities were conducted via the browser, as well as the client application for the particular provider.

Brett's review of the book can be found here.  Brett is also the author of the sole review available on the book's Amazon page.  It turns out that Brett was the technical editor of the book (he was also the technical editor for WFA 4/e, and he is the author of Placing the Suspect Behind the Keyboard), and as such, I was able to get a little bit of valuable insight into the process that went into getting this particular book published.  This was as enlightening as it is important, because not all books, even books produced by the same publisher, follow the same process.  A number of years ago, I was reading a book that was very popular at the time on the topic of computer forensics and incident response, and based on something I read, I contacted the authors to ask for clarification.  One of the authors responded with, "...we wrote that section three years ago and didn't touch it before the book was published."  So...not all books follow the "...sit down, write, review, publish..." format that is completed in a year (or less).

Pros
One of the things I liked about the book included the detailed, methodical approach that the authors took to populating their test environment with data, as it not only provides an excellent road map for testing, but also for reasoning during the analysis process.  Too many times in DFIR work, too much is left to assumption, in part because analysts simply receive a hard drive or image, and are not equipped to address potential gaps between the data they observe, and the questions that they need to answer.  One of the very first things I noticed about this book is the thorough approach taken to documenting the testing environment.

Also, the authors clearly stated the tools and versions that they used during their analysis.  Some analysts may not realize it, but this is very important, as tools can very in their capabilities (sometimes, quite significantly) between versions.

Reporting
This aspect of 'full disclosure' (i.e., clearly identifying the tools and versions used) are near and dear to me, as they are a significant aspect of chapter 9, Reporting, of my upcoming book, Windows Forensic Analysis 4/e.

On the subject of the tools used, when I read the tool listing on pg 27 (I was reading the soft cover edition, not the Kindle edition), in ch. 3, I thought back to the "challenges face by law enforcement and government agencies" in ch. 1; it occurred to me that the reason the authors were using the tools on that list was that those are the tools most often used by law enforcement and government agencies.

The authors address a great number of data sources, including not just Prefetch, LNK files, and Event Logs, but also browser artifacts.  The authors also explored (to some extent) what was still available in memory, as well.  This can be very valuable, as analysts should consider parsing available hibernation files, as well as the pagefile.

The chapters that address the actual location of artifacts include additional information regarding the use of anti-forensic techniques (through the use of tools such as Eraser and CCleaner), and illustrate the artifacts that remain.  Further, these chapters also include sections on Presentation, as well as tables that summarize the available artifacts.  I had found this type of summary to be very valuable when teaching courses, and it works equally well in the book.

Cons
The book was published in 2014, and very shortly into chapter 3, it already appears out of date.  For example, one of the tools used is "RegRipper version 20080909".

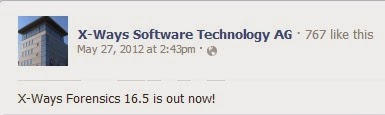
The version of X-Ways used in the book was version 16.5 which according to Facebook, first became available in May, 2012 (see the graphic to the right).  Now, I'm not bringing this up to say that the most up-to-date version of a tool must always be used...not at all.  But this information gives us a time frame to understand when the authors were writing the book.  It also brings into question why some artifacts...in this case, shellbags) were not discussed, as some of the discussions of artifacts were alarmingly light.  For example, on pg 40 (in ch 3), one sentence starts, "References were also found within the UsrClass.dat Registry files..."; clearly, the authors are referring to shellbags, but there was no further discussion of the artifact, nor anything that illustrated the artifact for the reader.  A similar reference to artifacts in the UsrClass.dat Registry hive was made on pg 75 (ch 4) and on pg 105 (ch 5), but again, there were no further details.

What's also curious about the Registry hive file references is that when the client applications are used to access the cloud storage, there is no mention in any of the three instances (mentioned in the previous paragraph) of UserAssist artifacts.  After all, it would stand to reason that when the user accesses the client application, they would most likely double-click an icon on their desktop, or click an entry on their Start menu...doing so would likely create artifacts in the UserAssist key.  The Registry section on pg 105 in particular specifically mentions the use of "keyword searches", which would not locate entries in the UserAssist key, as the value names are ROT-13 encrypted.

Many of the artifacts (RecentDocs listing from the Registry, Recycle Bin, browser artifacts) displayed in figures and tables in the book include time stamps (which allows us to see when the research was conducted), but there are no analysis techniques illustrated beyond simply locating and displaying the contents of the individual data sources.  Specifically, there are no illustrations of timeline analysis to illustrate not just the available artifacts, but how those artifacts might relate to each other.  There were several examples of timelines (figures 3.2, 4.4, etc.), but these were used for presentation of data, not for data analysis.

Summary
The book is very well structured, had a very methodical approach, and as such, it's easy to locate information in the book.  Each section is structured identically...when the Windows 7 PC is used to access SkyDrive or Dropbox, the sections listing the findings of artifacts are the same as when the iPhone 3G is used to access the same storage facilities.  This structure provides a framework for other analysts who want to use updated, more recent versions of the platforms (Windows 8, iPad, iPhone 5+, etc.), as well as of the client applications for the cloud storage facilities.

However, the book was a bit light on the approach to artifacts; rather than taking a targeted approach to artifact (i.e., shellbags, etc.) analysis, and using timelines in the analysis of the systems, the primary means of analysis appears to have been keyword searches and the use of tools such as Magnet Forensics' IEF.  There is nothing inherently wrong or incorrect about this approach, other than that this approach is known to miss certain artifacts (i.e., UserAssist data).  I had hopped that the backgrounds of the authors, particular the number of forensic investigations undertaken by one, would have obviated sections of the book that included, "...keyword was found in the UsrClass.dat file...".

Sunday, January 12, 2014

Malware RE - IR Disconnect

Not long ago, I'd conducted some analysis that I had found to be...well, pretty fascinating...and shared some of the various aspects of the analysis that were most fruitful.  In particular, I wanted to share how various tools had been used to achieve the findings and complete the analysis.

Part of that analysis involved malware known as PlugX, and as such, a tweet that pointed to this blog post recently caught my attention.  While the blog post, as well as some of the links in the post, contains some pretty fascinating information, I found that in some ways, it illustrates a disconnect between the DFIR and malware RE analysis communities.
Caveat
I've noticed this disconnect for quite some time, going back as far as at least this post...however, I'm also fully aware that AV companies are not in the business of making the job of DFIR analysts any easier.  They have their own business model, and even if they actually do run malware (i.e., perform dynamic analysis), there is no benefit to them (the AV companies) if they engage in the detailed analysis of host-based artifacts.  The simple fact and the inescapable truth is that an AV vendors goals are different from those of a DFIR analyst.  The AV vendor wants to roll out an updated .dat file across the enterprise in order to detect and remove all instances of the malware, whereas a DFIR analyst is usually tasked with answering such questions as "...when did the malware first infect the system/infrastructure?", "...how did it get in?", and "...what data was taken?"

These are very different questions that need to be addressed, and as such, have very different models for the businesses/services that address them.  This is not unlike the differences between the PCI assessors and the PCI forensic analysts.

Specifically, what some folks on one side find to be valuable and interesting may not be useful to folks on the other side.  As such, what's left is two incomplete pictures of the overall threat to the customer, with little (if any) overlap between them.  In the end, this simply leads not only both sides to having an incomplete view of what happened, and the result is that what's provided to the customer...the one with questions that need to be answered...aren't provided the value that could potentially be there.

I'd like to use the Cassidian blog post as an example and walk through what I, as a host-based analysis guy, see as some of the disconnects.  I'm not doing this to highlight the post and say that something was done wrong or incorrectly...not at all.  In fact, I greatly appreciate the information that was provided; however, I think that we can all agree that there are disconnects between the various infosec sub-communities, and my goal here is to see if we can't get folks from the RE and IR communities to come together just a bit more.  So what I'll do is discuss/address the content from some of the sections if the Cassidian post.

Evolution
Seeing the evolution of malware, in general, is pretty fascinating, but to be honest, it really doesn't help DFIR analysts understand the malware, to the point where it helps them locate it on systems and answer the questions that the customer may have.  However, again...it is useful information and is part of the overall intelligence picture that can be developed of the malware, it's use, and possibly even lead to (along with other information) attribution.

Network Communications
Whenever an analyst identifies network traffic, that information is valuable to SOC analysts and folks looking at network traffic.  However, if you're doing DFIR work, many times you're handed a hard drive or an image and asked to locate the malware.  As such, whenever I see a malware RE analyst give specifics regarding network traffic, particularly HTTP requests, I immediately want to know which API was used by the malware to send that traffic.  I want to know this because it helps me understand what artifacts I can look for within the image.  If the malware uses the WinInet API, I know to look in index.dat files (for IE versions 5 through 9), and depending upon how soon after some network communications I'm able to obtain an image of the system, I may be able to find some server responses in the pagefile.  If raw sockets are used, then I'd need to look for different artifacts.

Where network communications has provided to be very useful during host-based analysis is during memory analysis, such as locating open network connections in a memory capture or hibernation file.  Also, sharing information between malware RE and DFIR analysts has really pushed an examination to new levels, as in the case where I was looking at an instance where Win32/Crimea had been used by a bad guy.  That case, in particular, illustrated to me how things could have taken longer or possibly even been missed had the malware RE analyst or I worked in isolation, whereas working together and sharing information provided a much better view of what had happened.

Configuration
The information described in the post is pretty fascinating, and can be used by analysts to determine or confirm other findings; for example, given the timetable, this might line up with something seen in network or proxy logs.  There's enough information in the blog post that would allow an accomplished programmer to write a parser...if there were some detailed information about where the blob (as described in the post) was located.

Persistence
The blog post describes a data structure used to identify the persistence mechanism of the malware; in this case, that can be very valuable information.  Specifically, if the malware creates a Windows service for persistence.  This tells me where to look for artifacts of the malware, and even gives me a means for determining specific artifacts in order to nail down when the malware was first introduced on to the system.  For example, if the malware uses the WinInet API (as mentioned above), that would tell me where to look for the index.dat file, based on the version of Windows I'm examining.

Also, as the malware uses a Windows service for persistence, I know where to look for other artifacts associated (Registry keys, Windows Event Log records, etc.) with the malware, again, based on the version of Windows I'm examining.

Unused Strings
In this case, the authors found two unused strings, set to "1234", in the malware configuration.  I had seen a sample where that string was used as a file name.

Other Artifacts
The blog post makes little mention of other (specifically, host-based) artifacts associated with the malware; however, this resource describes a Registry key created as part of the malware installation, and in an instance I'd seen, the LastWrite time for that key corresponded to the first time the malware was run on the system.

In the case of the Cassidian post, it would be interesting to hear if the FAST key was found in the Registry; if so, this might be good validation, and if not, this might indicate either a past version of the malware, or a branch taken by another author.

Something else that I saw that really helped me nail down the first time that the malware was executed on the system was the existence of a subkey beneath the Tracing key in the Software hive.  This was pretty fascinating and allowed me to correlate multiple artifacts in order to develop a greater level of confidence in what I was seeing.

Not specifically related to the Cassidian blog post, I've seen tweets that talk about the use of Windows shortcut/LNK files in a user's Startup folder as a persistence mechanism.  This may not be particularly interesting to an RE analyst, but for someone like me, that's pretty fascinating, particularly if the LNK file does not contain a LinkInfo block.

Once again, my goal here is not to suggest that the Cassidian folks have done anything wrong...not at all.  The information in their post is pretty interesting.  Rather, what I wanted to do is see if we, as a community, can't agree that there is a disconnect, and then begin working together more closely.  I've worked with a number of RE analysts, and each time, I've found that in doing so, the resulting analysis is more complete, more thorough, and provides more value to the customer.  Further, future analysis is also more complete and thorough, in less time, and when dealing with sophisticated threat actors, time is of the essence.

Saturday, December 28, 2013

Quick Post

RegRipper
At the end of this past summer and into the fall, I was working on the print matter for Windows Forensic Analysis 4/e, and I'm in the process now of getting extra, downloadable materials (I decided a while back to forego the included DVD...) compiled and ready to post.  During the entire process, and while conducting my own exams, I have updated a number of aspects of RegRipper...some of the code to RegRipper itself has been updated, and I've written or updated a number of plugins.  Some recent blogs that have been posted have really provided some information that have led to updates, or at least to a better understanding of the artifacts themselves (how they're created or modified, etc.).

I figured that it'll be time soon for an update to RegRipper.  To that end, Brett has graciously provided me access to the Wordpress dashboard for the RegRipper blog, so this will be THE OFFICIAL SITE for all things RegRipper.

Now, I know that not everyone who uses RegRipper is entirely familiar with the tool, how to use it, and what really constitutes "Registry analysis".  My intention is to have this site become the clearing house for all information related to RegRipper, from information about how to best use the tool to new or updated plugins.

I think that one of the biggest misconceptions about RegRipper is that it does everything right out of the box.  What people believe RegRipper does NOT do has been a topic of discussion, to my knowledge, since a presentation at the SANS Forensic Summit in the summer of 2012.  Unfortunately, in most cases, folks have used presentations and social media to state what they think RegRipper does not do, rather than ask how to get it do those things.  Corey has done a fantastic job of getting RegRipper to do things that he's needed done.  From the beginning, RegRipper was intended to be community-based, meaning that if someone needed a plugin created or modified, they could go to one resource with the request and some sample data for testing, and that's it.  That model has worked pretty well, when it's been used.  For example, Corey posted a great article discussing PCA, Yogesh posted about another aspect of that topic (specifically, the AmCache.hve file), and Mari shared some data with me so that I could get a better, more thorough view of how the data is maintained in the file.  Now, there's a RegRipper plugin that parses this file.  The same thing is true with shellbags...thanks to the data Dan provided along with his blog post, there have been updates to the shellbags.pl plugin.

So, expect to see posts to the RegRipper site in 2014, particularly as I begin working on the updates to Windows Registry Forensics.

USB Devices
Speaking of the Registry...

Thanks to David, I saw that Nicole recently posted some more testing results, this time with respect to USB device first insertion.  She also has a post up regarding directory transversal artifacts for those devices; that's right, another shellbag artifact post!  Add this one to Dan's recent comprehensive post regarding the same artifacts, and you've got quite a bit of fascinating information between those two posts!

Reading through the posts, Nicole's blog is definitely one that you want to add to your blogroll.

Yogesh posted to his blog recently on USB Registry artifacts on Windows 8, specifically with respect to some Registry values that are new specifically to Windows 8.   

Wednesday, December 18, 2013

Shellbags

Dan recently posted what has to be one of the most thorough/comprehensive blog articles regarding the
Windows shellbags artifacts.  His post specifically focuses on shellbag artifacts from Windows 7, but the value of what he wrote goes far beyond just those artifacts.

Dan states at the very beginning of his post that his intention is to not focus on the structures themselves, but instead address the practical interpretation of the data itself.  He does so, in part through thorough testing, as well as illustrating the output of two tools (one of which is commonly used and endorsed in various training courses) side-by-side.

Okay, so Dan has this blog post...so why I am I blogging about his blog post?  First, I think that Dan's post...in both the general and specific sense...is extremely important.  I'm writing this blog post because I honestly believe that Dan's post needs attention.

Second, I think that Dan's post is just the start.  I opened a print preview of his post, and with the comments, it's 67 pages long.  Yes, there's a lot of information in the post, and admittedly, the post is as long as it is in part due to the graphic images Dan includes in his post.  But this post needs much more attention than "+1", "Like", and "Good job!" comments.  Yes, a number of folks, including myself, have retweeted his announcement of the post, but like many others, we do this in order to get the word out.  What has to happen now is that this needs to be reviewed, understood, and most importantly, discussed.  Why?  Because Dan's absolutely correct...there are some pretty significant misconceptions about these (and admittedly, other) artifacts.  Writing about these artifacts online and in books, and discussing them in courses will only get an analyst so far.  What happens very often after this is that the analyst goes back to their office and doesn't pursue the artifacts again for several weeks or months, and by the time that they do pursue them, there are still misconceptions about these artifacts.

Shell Items
This discussion goes far beyond simply shellbags, in part because the constituent data structures, the shell items, are much more pervasive on Windows systems that I think most analysts realize, and they're becoming more so with each new version.  We've known for some time that Windows shortcut/LNK files can contain shell item ID lists, and with Windows 7, Jump Lists were found to include LNK structures.  Shell items can also be found in a number of Registry values, as well, and the number of locations has increased between Vista to Windows 7, and again with Windows 8/8.1

Consider a recent innovation to the Bebloh malware...according to the linked article, the malware deletes itself when it's loaded in memory, and then waits for a shutdown signal, at which point it writes a Windows shortcut/LNK file for persistence.  There's nothing in the article that discusses the content of the LNK file, but if it contains only a shell item ID list and no LinkInfo block (or if the two are not homogeneous), then analysts will need to understand shell items in order to retrieve data from the file.

These artifacts specifically need to be discussed and understood to the point where an analyst sees them and stops in their tracks, knowing in the back of their mind that there's something very important about them, and that the modification date and time don't necessarily mean what they think.  It would behoove analysts greatly to take the materials that they have available on these (and other) artifacts, put them into a format that is most easily referenced, keep it next to their workstation and share it with others.

Publishing Your Work
A very important aspect of Dan's post is that he did not simply sit back and assume that others, specifically tool authors and those who have provided background on data structures, have already done all the work.  He started clean, by clearing out his own artifacts, and walking through a series of tests without assuming...well...anything.  For example, he clearly pointed out in his post that the RegRipper shellbags.pl plugin does not parse type 0x52 shell items; the reason for this is that I have never seen one of these shell items, and if anyone else has, they haven't said anything.  Dan then made his testing data available so that tools and analysis processes can be improved.  The most important aspect of Dan's post is not the volume of testing he did...it's the fact that he pushed aside his own preconceptions, started clean, and provided not just the data he used, but a thorough (repeatable) write-up of what he did.  This follows right in the footsteps of what others, such as David CowenCorey Harrell and Mari DeGrazia, have done to benefit the community at large.

Post such as Dan's are very important, because very often artifacts don't mean what we may think they mean, and our (incorrect) interpretation of those artifacts can lead our examination in the wrong direction, resulting is the wrong answers being provided as a result of the analysis.

Monday, December 16, 2013

Updates

Things tend to move fast in the DFIR world sometimes, and since my last post, there have been some updates to some of the things that were mentioned/discussed, and those updates were important enough that I thought that they needed to be visible.

Page_brute
Robert has updated his blog post on restoring Windows CMD sessions from the pagefile; the update includes an updated Yara rule.

AmCache
Thanks to some data shared by a friend, I was able to see that not all of the File subkeys in the AmCache.hve file will have a SHA-1 hash listed.  This does nothing to obviate Yogesh's work in this area; in fact, I would suggest that it opens the question of what data is recorded and under which circumstances, making this an even more important resource.  I'd sent Mari a copy of the RegRipper amcache.pl plugin to try out, and she found that it crashed...it turns out this was due to the fact that not all of the subkeys had a value named "101" (see Yogesh's blog post with the values listed); I got that fixed right away.

Yogesh has since posted part 2 of his series of blog posts discussing the AmCache.hve file.  Yogesh addresses other subkeys within the AmCache.hve file, as well as some other files within the same folder.  If you're at all interesting in seeing some of what's new in Windows 8/8.1, specifically for DFIR analysts, take a look.

Shellbags
Thanks to Dan's research regarding shellbags artifacts, as well as his willingness to share his test data, I've been updating the RegRipper shellbags.pl plugin.  As of now, it's capable of parsing the type 0x52 shell items that Dan found, and it provides the key path for the resources.  So, instead of just:

Control Panel\User Accounts\Create Your Password 
Control Panel\User Accounts\Change Your Picture 

...now you'll see:

Control Panel\User Accounts\Create Your Password [Desktop\0\3\0\0\]
Control Panel\User Accounts\Change Your Picture [Desktop\0\3\0\1\]

The purpose of this is to allow analysts to validate what they're seeing much more easily.  Using this additional information, analysts can validate the embedded DOSDate MAC times, among other things.

I hope that this blog post helps analysts understand the embedded DOSDate time stamps within shell items.

With respect to shellbags, something "interesting" I've found is that the MFT file reference that can be found in some shell items that comprise the shellbags artifacts can a bit misleading; well, maybe not "misleading" but not easily validated. While I've been able to validate the accuracy of this information for folders on local hard drives (I have the MFT as well as the USRCLASS.DAT hive in some data sets), for removable drives and other resources, the data cannot be validated without the MFT from that external resource.  As such, at this point, I'm debating whether to provide the MFT file reference in the plugin output, or comment out that code (which would allow someone to un-comment it).

Part of the reason why I'm debating (with myself, mostly) whether or not to provide this information in the output of the plugin is that right now, there's a great deal of information being displayed, and I'm afraid that not all of it is all that well understood.  I've seen analysts try to fit the data they're seeing in the tool output to their theory by assuming (albeit incorrectly) what the data means, and that just doesn't work.  In fact, it can be disastrous to the examination.

For example, here's an extract from the output of the current version of the shellbags.pl plugin, run against a sample data set:

| 83/8           |My Computer\D:\VM [Desktop\1\2\5\]
| 275/2         |My Computer\D:\VM\Win2008 [Desktop\1\2\5\0\]
| 84/6          |My Computer\D:\VM\Win7 [Desktop\1\2\5\1\]
| 5402/3       |My Computer\D:\VM\Win2003 [Desktop\1\2\5\2\]
| 5410/2       |My Computer\D:\VM\XP2 [Desktop\1\2\5\3\]
| 5422/6       |My Computer\D:\VM\XP3 [Desktop\1\2\5\5\]
| 404/43       |My Computer\D:\test [Desktop\1\2\6\]
| 405/43       |My Computer\D:\vsc [Desktop\1\2\7\]

Now, I have the image of the system from which this data was extracted, so I've been able to extract and parse the MFT in order to verify the MFT file references, which are listed as the MFT record number, followed by the sequence number.  So, for an analyst that has an image, or even just the hive file and the MFT available, it's a simple matter to determine whether the path listed in the output of the tool can be referenced to a current record in the MFT, or to an older, historic record.  An example of this would be where the MFT file reference for the D:\test folder (as illustrated above) is "404/43" in the shellbags, but MFT record 404 in the current MFT has a higher sequence number (44 or above) and a different name.

Okay, as if that's not confusing enough, what happens if you have MFT file references for paths that are NOT on hard drive local to the system?  Consider the following:

| 136/5        |My Computer\F:\seattle\Tools [Desktop\1\1\36\0\]
| 556/37      |My Computer\F:\seattle\Tools\case2 [Desktop\1\1\36\0\0\]
| 560/3        |My Computer\F:\seattle\Tools\case1 [Desktop\1\1\36\0\1\]

In this case, this information was pulled from one of my own systems, and I know that the F:\ volume was, in fact, an external USB-connected wallet drive.  Without the MFT from the wallet drive, this information cannot be validated.  Is this data then useful?

How Valuable Is Data?
All of this brings up a very important question...specifically, what data is valuable, and how valuable is it? Can value be assessed differently by different analysts, or is data value somewhat universal?

What is the value of the data if it is misunderstood by the analyst? Is the value of the data diminished if the analyst follows it down the wrong path, based on misunderstood data and incorrect assumptions?

Here's an example - below at the embedded MAC times taken from the D:\VM\Win2003 entry above:
M: 2011-08-18 23:55:46
A: 2011-08-18 23:55:46
C: 2011-08-18 23:48:32

What do these time stamps mean? What is the "value" of this data?

SAM Hive
Lance posted an EnScript that parses the SAM Registry hive file and displays the users in each security group.

This has been an integral part of the RegRipper samparse.pl plugin for some time now, and it's great to see the need for this information being recognized and brought to other tools.

Addendum, 17 Dec: On the heels of Corey's RecentFileCache.bcf post, Lance has written an EnScript to parse the file.  I told you...sometimes you can go weeks without anything going on in the DFIR world, and then all of sudden, things start to happen fast!

Addendum, 18 Dec: Corey posted another PCA article, this one addressing Registry keys that maintain data (not configuration information) regarding indicators of program execution.  Great stuff!

Wednesday, December 04, 2013

Links and News

There have been some exciting developments recently on the Windows digital forensic analysis front, and I thought it would be a good idea to bring them all together in one place.

Recover CMD sessions from the pagefile
If you perform analysis of Windows systems at all, be sure to check out Robert's blog post that discusses how to use page_brute (which I'd mentioned previously here) to recover command prompt sessions from the Windows pagefile.  In the post, the author mentions quite correctly that grabbing a memory image still isn't something that's part of standard incident response procedures.  If you receive a laptop system (or an image thereof) you may find a hibernation file, which you can then analyze, if doing so is something that will help you attain your goals.

Page_brute is based on Yara rules, and Robert shares the rule that he wrote...if you look at it, and follow his reasoning in the post, it's amazingly simple AND it works!

This sort of analysis can be very valuable, particularly if you don't have a memory dump available.  As we learned at OMFW 2013, Volatility is moving in the direction of incorporating the pagefile into analysis, which is fantastic...but that's predicated by the responder's ability to capture a memory dump prior to shutting the system down.

I got yara-python installed (with some help...thanks!) and I then extracted the pagefile from an image I have available.  I had also copied the rule out of Robert's blog post, and pasted it into the default_signatures.yar file that is part of page_brute, and ran the script.  In fact, page_brute.py worked so well, that as it was running through the pagefile and extracting artifacts, MS Security Essentials "woke up" and quarantined several extracted blocks identified as Exploit:js/Blacole, specifically KU and MX variants.  I then opened a couple of the output files from the CMDscan_Optimistic_Blanklines folder, and I wasn't seeing any of the output that Robert showed in his blog post, at least not in the first couple of files.  So, I ran strings across the output files, using the following command:

D:\Tools>strings -n 5 H:\test\output\CMDscan_Optimistic_Blanklines\*.page | find "[Version"

I didn't get anything, so I ran the command again, this time without the "[", and I got a number of strings that looked like Registry key paths.  In the end, this took some setup, downloading a script and running two commands, but you know what...even with that amount of effort, I still got 'stuff' that I would not have gotten as quickly.  Not only has page_brute.py proved to be very useful, it also illustrates what can be done when someone wants to get a job done.

Resources
Excellent Yara post; look here to get the user manual and see how to write rules.

Registry Forensics Class
If you're interested in an online course in analyzing the Windows Registry, Andrew Case, Vico Marziale, and Joe Sylve put together the Registry Analysis Master Class over at The Hacker Academy.  If you're interested in the course, take a look at Ken Pryor's review of the class to see if this is something for you.

Windows Application Experience and Compatibility
Corey's got a new blog post up where he discusses the Windows Application Experience and Compatibility feature, and how the RecentFileCache.bcf file can serve as a data source indicating program execution.  As usual, Corey's post is thorough, referencing and building on previous work.

Corey shared a link to his blog post over on the Win4n6 Yahoo group, and Yogesh responded that he's doing some research along the same lines, as well, with a specific focus on Windows 8 and the AmCache.hve file, which follows the same file format as Windows Registry hives.  Yogesh's blog post regarding the AmCache.hve file can be found here.  Why should you care about this file?  Well, from the post:

This file stores information about recently run applications/programs. Some of the information found here includes Executable full path, File timestamps (Last Modified and Created), File SHA1 hash, PE Linker Timestamp, some PE header data and File Version information (from Resource section) such as FileVersion, ProductName, CompanyName and Description.

This information can be very valuable during analysis; for example, using the SHA-1 hash, an analyst could search VirusTotal for information regarding a suspicious file.  The file reference number from the key name could possibly be used to locate other files that may have been written to the system around the same time.
More Stuff
As I was working on a RegRipper plugin for parsing and presenting the data in the AmCache.hve file, I ran across something interesting, albeit the fact that I have only one sample file to look at, at the moment.  Beneath the Root key is a Programs subkey, and that appears to contain subkeys for various programs.  The values within each of these subkeys do not appear to correspond to what Yogesh describes in his post, but there are some very interesting value data available.  For example, the Files value is a multi-string value that appears to reference various files beneath the Root\Files subkey (as described in Yogesh's post) that may be modules loaded by the program.  This can provide for some very interesting correlation, particularly if it's necessary for your analysis.

Yogesh has been posting some great information over on his blog recently, specifically with respect to Registry and Windows Event Log artifacts associated with USB devices connected to Windows 8 systems.  Be sure to add it to your daily reading, or to your blog roll, in order to catch updates.

Wednesday, November 20, 2013

Sniper Forensics, Memory Analysis, and Malware Detection


I conducted some analysis recently where I used timeline analysis, Volatility, and the Sniper Forensics concepts shared by Chris Pogue to develop a thorough set of findings in relatively short order.

I was analyzing an image acquired from a system thought to have been infected with Poison Ivy.  All I had to go on were IPS alerts of network traffic originating from this system on certain dates...but I had no way to determine how "close" the clocks were for the system and the monitoring device.

I started by creating a timeline, and looking for the use of publicly documented persistence mechanisms employed by the malware in question (Windows service, StubPath values within "Installed Components" Registry keys, etc.), as well as looking for the use of NTFS alternate data streams.  All of these turned up...nothing.  A quick review of the timeline showed me that McAfee AV was installed on the system, so I mounted the image via FTK Imager and scanned it with ClamWin 0.98 and MS Security Essentials (both of which were updated immediately prior to the scan).  MSSE got a hit on a file in the system32 folder, which later turned out to be the initial installer.  I searched the timeline, as well as the Software and System Registry hives for the file name, and got no hits beyond just the existence of that file within the file system.

The system was a laptop system and had a hibernation file, which was last modified the day that the system itself had been shut down.  I exported the hibernation file for analysis, and then downloaded the Win32 standalone version of Volatility version 2.3.1, and used that to convert the hibernation file to raw format, then identify the profile (via the imageinfo plugin) and get a process list (via the pstree plugin).

I got in touch with Jamie Levy (@gleeda), who pointed me to this post, which was extremely helpful.  Based on the output of the malfind plugin, I was able to identify a possible process of interest, and I searched the timeline for the executable file name, only to find nothing.  However, I did have a process ID to correlate to the output of the pstree plugin, and I could see that the process in question was a child of services.exe, which told me not only where to look, but also that the installation process required at least Administrator-level privileges.  Correlating information between the RegRipper samparse.pl and profilelist.pl plugins, I was able to see which user profiles (both local and domain) on the system were members of the appropriate group.  This also provided me with the start time for both processes, which correlated to the system being started.

A fellow team member had suggested running strings across the memory dump, and then searching the output for specific items; doing so, I found what appeared to be the configuration information used by Poison Ivy (which was later confirmed via malware RE performed by another team member).  As a refinement to that approach, I ran the Volatility vaddump plugin, targeting the specific process, and dumped all of the output files to a folder.  I then ran strings across all of the output folders, and found a similar list of items as when I'd run strings across the entire memory dump.

I validated the configuration item findings via the Volatility handles plugin, looking for mutants within the specific process.  I also dumped the process executable from the memory dump via the procmemdump plugin; the first time I did it, MSSE lit up and quarantined the file, so I disabled MSSE and re-ran the plugin (I set my command prompts with QuickEdit and Insert modes, so re-running the command line as as simple as hitting the up-arrow once, and then hitting Enter...).  I was able to ship the dumped PE file and the initial wrapper I found to a specialist for analysis while I continued my analysis.

I then ran the svcscan plugin and searched the output for the executable file name, and found the Windows service settings, to include the service name.  I also ran the dlllist plugin to see if there were any DLLs that I might be interested in extracting from the image.

I also ran the netscan plugin, and reviewing the output gave no indication of network connections associated with the process in question.  Had there been a connection established associated with the process of interest, I would've run Jamaal's ethscan module, which he talked about (however briefly) at the recent OMFW.

I had downloaded the Poison Ivy plugin, which according to the headers, is specific to one version of the PIvy server.   The plugin ran for quite a while, and because I had what I needed, I simply halted it before it completed.

Timing
Something important to point out here is that the analysis that I've described here did not take days or weeks to complete; rather, the research and memory analysis was all completed in just a few hours on one evening.  It could have gone a bit quicker, but until recently, I haven't had an opportunity to do a lot of this type of analysis.  However, incorporating a "Sniper Forensics" thought process into my analysis, and in turn making the best use of available tools and processes, allowed me develop findings in an efficient and thorough manner.

In short, the process (with Volatility plugins) looks like this:
- convert, imageinfo, pstree
- malfind - get PID
- run vaddump against the PID, then run strings against the output
- run handles against the PID
- run procmemdump against the PID (after disabling AV)
- run dlllist against the PID
- run netscan; if connections are found associated with the PID, run ethscan

At this point, I had a good deal of information that I could add to my timeline in order to provide additional context, granularity, and relative confidence in the data I was viewing.  File system metadata can be easily modified, but Windows Event Log records indicating service installation and service start can be correlated with process start times, assisting you in overcoming challenges imposed by the use of anti-forensics techniques.

It's also important to point out that Registry, timeline, and memory analysis are all tools, and while they're all useful, each of them in isolation is nowhere near as powerful as using them all together.  Each technique can provide insight that can either augment or be used as pivot points for another.

Resources
A couple of interesting items have popped up recently regarding memory acquisition and analysis, and I thought it would be a good idea to provide them here:
  • Jamie also pointed me to this post, which, while it wasn't directly helpful (the image I was working with was from a Win7SP1 system), it does show the thought process and work flow in solving the challenge
  • From MoonSols, some new features in DumpIt
  • Mark Baggett's ISC Diary posts on winpmem and its uses: here, and here
  • Page_brute - check out how you can incorporate the pagefile into your analysis, until Volatility v3 hits the streets

Wednesday, November 13, 2013

Tools, Malware, and more conference follow-up

Tools
Arsenal Recon - Image Mounter utility: the web site says that the tool is "currently geared towards digital forensics and incident response developers, but we have released a sample GUI and command line mount/management utility known as "MountTool" as a proof of concept."

The web site goes on to say, "We have heard that others in the DFIR community are already building better GUIs and extending the functionality of Arsenal Image Mounter..."; this is great to hear, and I hope that this is something that becomes public.  Having a proof of concept tool is great to test things out, but seeing something that extends the capabilities of the utility is even better, and I think, far more useful.

Willi Ballenthin's EVXTractHere is Willi's presentation from the SANS Summit in Prague, on 6 Oct 2013.  In the sixth slide, Willi mentions the 6 steps to carving EVT records from unallocated space or other unstructured data.  Somewhere in there, perhaps step 4a, should be "given the record size, read that number of bytes into the buffer, and the last 4 bytes should be the same as the first four bytes".  This is the "sanity check" I've used as an initial step for validating EVT records.

Anyway, what Willi's presentation and materials really demonstrate for me is the move to carving for records rather than full files.  Yes, others have been doing this for a while, in particular the MagnetForensics folks with their IEF product, but that's not an open source tool.  Understanding data structures and going after the individual records can be far more fruitful than going after full files.

Mari has written up an excellent post detailing how to retrieve deleted data from a SQLite database; she's even provided a Python-based parser.  This is yet another aspect of data retrieval that is based on a detailed knowledge and understanding of data structures, similar to what was discussed here (IE index.dat deleted records), and here (MFT resident file residue).

Lance's post regarding the tools he turns to during examinations, broken down by tiers.  His list is very useful in that it illustrates a thought process that others can look at for comparison.  I can't say that I have a similar breakdown, which probably has more to do with the types of analysis I tend to get engaged in, and the prior information that each of us may have available.

Of course, how a tool is used can also be very valuable information.  For example, from Lance's post, as
well as what I saw at OSDFC, folks use RegRipper, but apparently not the way I use it.  It seems that the predominant means of using RegRipper is to just run all the plugins against the available hives.  That may be good for some folks, but like Corey Harrell, I tend to take something of a more targeted approach.  Often during my own examinations, I don't need everything...in fact, getting everything can often be an expenditure of time and effort that I can't afford, as I have to sort through a lot of data that isn't particularly useful or beneficial.  While in some instances it is useful to take a broader approach, there are times and circumstances when it's far more beneficial to take something of a targeted approach, if for no other reason to do a quick check and get something of value quickly, leaving the everything for later.  At times, I've found it very beneficial to use a Registry viewer (WRR is pretty good, although it doesn't handle "big data" values) for viewing and searches, then run specific RegRipper plugins, and then have a plugin open in an editor for tweaking.  That's kind of how I went about this work involving shell items.

Based on recent conferences, I'm going to have to look at adding TSK Autopsy  to one of my own tiers.

Malware Response and Analysis
Claus has a new post up regarding his Anti-Malware Response Go Kit; in this case, Claus discusses more about his requirements and process, whereas some of his previous posts have been admittedly valuable lists of tools.  The one correction I would offer up, however, is in the section where he briefly discusses RegRipper: "Plugins are developed by the community..." - actually, not so much, really.  Yes, there are a number of plugins developed by other folks, for which I am very thankful, and offer a huge thanks to them for doing so. Other plugins were developed or extended because someone (Corey Harrell) saw the need and reached out to me, but for the most part, the majority of the development of plugins have not been something that's sought after by the community at large.  I have updated a couple of plugins (appcompatcache.pl) to support Windows 8/8.1 thanks to the suggestion and submission of additional test data by Eric Z.  Also, I've written a number of malware-specific, "tactical" plugins based on something I've seen, usually within just a couple of minutes of reading the material...but again, these are not something that have been requested or sought by the community.

From the Handler's Diary blog, Analyzing Malicious Processes: very cool use case for Volatility.  Not only does the post illustrate how to use Volatility, but it also clearly illustrates what an artifact (in this case, of lateral movement) "looks like", which is something that we often don't see addressed.  Even though artifacts are mentioned, many times, there's very little information about what to look for on disk or in memory with respect to those artifacts.

Also from the Handler's Diary - jackcr's DFIR challenge summary; Jamie Levy (@gleeda) referred to this challenge in her "Every Step You Take: Profiling the System" talk at OMFW2013.

From Lenny Zeltser, a list of XOR obfuscation examination tools.

Win32/Trooti is an example of malware that "parks" on a vacant SvcHost value.  [TrendMicro, M86 Security]  It's interesting how the different write-ups address the particular value on which the malware "parks"...some tell us that it happens, others share the results of their particular analysis.  More than anything else, I think that this information can help us in reviewing and if necessary, updating our own malware detection techniques.

Conference Followup
There's another write up available regarding recent conferences, in this case, the same ones I was able to attend.  As such, the write-up provides something of a different perspective.  You can find the OMFW & OSDFC Recap post over at the HiddenIllusion blog site.  This post is more of a blow-by-blow of the conferences, and it does give an interesting perspective on the conferences.  A couple of things I wanted to comment on (and this doesn't mean that I disagree...):

From the general notes: "I was told that my tweets and recap post of last years activities was helpful to those who couldn't attend..." - this is much more of a truism than most really recognize, I think.  Not everyone can attend conferences, but very often we're able to learn more about which conferences or events would be most beneficial to us by what others share about their experiences; what was good, what wasn't so good, what there should be more or less of, etc.  This sort of feedback can not only be valuable to folks who are planning out their conference attendance, but it can also be extremely valuable to conference organizers and presenters, as well.  For example, in the OSDFC section, there was this quote:

On the disappointing side - I did feel like I was seeing a noticeable amount of people doing the same things as others have already done.

That's extremely valuable to know.  Yes, you're right...there was content that would make folks think, "wow, I've seen this stuff before", and there could be any number of reasons for that.  Sometimes, I think folks pursue something because they're seeing it for the first time, and they don't do a comprehensive literature search prior to kicking off their research.  Sometimes, this is good, because it's done for educational purposes, and the researcher may find something new.  Remember though...this year, the conference program was crowd-sourced, so it wasn't Brian and the BasisTech staff who decided which presentations would be given.

Under the "Memoirs of a Hidsight[sic] Hero" section, the author says, "Don't try and write a book about Mac rootkits..."; it wasn't so much that Cem was out to disprove the authors because they were writing a book.  Rather, my take was that Cem heard the claims of near-complete anonymity and thought, "that can't be right", and ended up disproving the claims.  Maybe the take away from this one would be, "...if you're going to write a book on Mac rootkits, get Cem as a co-author or tech editor."  ;-)

With respect to the MantaRay presentation: "...maybe useful for others but doesn't fit into my process flow." This is exactly right...depending upon the types of issues you face, you may not need to run every tool every time.  However, one of the useful things about tools like MantaRay and it's predecessor, TapeWorm, is that very often, they're configurable.  That is, you can trim them down or add to them in order to meet your needs.  The guys who developed MantaRay have provided the tools for use by others, which is great, particularly for folks with similar use-cases, or those new to the issue at hand.

Thursday, November 07, 2013

Conferences

I recently had the opportunity (and honor) of attending the Open Memory Forensics Workshop (OMFW) and the Open Source Digital Forensics Conference (#OSDFCon), held in Chantilly, VA.  I've attended both conferences in the past, had a great time, and this time around was no different.

OMFW
I've always enjoyed the format that Aaron has used for the OMFW, going back to the very first one.  That first time, there was a short presentation followed by a panel, and back and forth, with breaks.  It was fast-moving, the important stuff was shared, and if you wanted more information, there was usually a web site that you could visit in order to download the tools, etc.

This time around, there was greater focus on things like upcoming updates to Volatility, and the creation of the Volatility Foundation.  Also, a presentation by George M. Garner, Jr., was added, so there were more speakers, more variety in topics discussed, and a faster pace, all of which worked out well.

The presentations that I really got the most out of were those that were more akin to use cases.

Sean and Steven did a great job showing how they'd used various Volatility plugins and techniques to get ahead of the bad guys during an engagement, by moving faster than the bad guys could react and getting inside their OODA loop.

Cem's presentation was pretty fascinating, in that it all seemed to have started with a claim by someone that they could hide via a rootkit on Mac OSX systems.  Cem's very unassuming, and disproved the claim pretty conclusively, apparently derailing a book (or at least a chapter of the book) in the process!

Jamie's presentation involved leveraging CybOX with Volatility, and was very interesting, as well as well-received.

There was more build-up and hype to Jamaal's presentation than there was actual presentation!  ;-)  But that doesn't take anything at all from what Jamaal talked about...he'd developed a plugin called ethscan that will scan a memory dump (Windows, Linux, Mac) and produce a pcap.  Jamaal pointed out quite correctly that many times when responding to an incident, you won't have access to a pcap file from the incident; however, it's possible that you can pull the information you need out of the memory buffer from the system(s) involved.

What's really great about OMFW is that not only does Aaron get some of the big names that are really working hard (thanks to them!) to push the envelope in this area of study to present, but there are also a lot of great talks in a very short time period.  I'll admit that I wasn't really interested in what goes into the framework itself (that's more for the developers), but there were presentations on Android and Linux memory analysis; there's something for everyone.  You may not be interested in one presentation, but wait a few minutes...someone will talk about a plugin or a process, and you'll be glued to what they're saying.

Swag this year was a cool coffee mug and Volatility stickers.

Here's a wrap-up from last year's conference.  You can keep up on new developments in Volatility, as well as the Volatility training schedule, at the Volatility Labs blog.

OSDFCon
I've attended this conference before, and just as in the past, there is a lot of great information shared, with something for everyone.  Personally, I'm more interested in the talks that present how a practitioner used open source tools to accomplish something, solve a problem, or overcome a challenge.  I'm not so much interested in academic presentations, nor so much in talks that talk about open source tools that folks have developed.  As in the past, I'd suggest yet again that there be multiple tracks for this conference...one for academics and developers, and another for practitioners, by practitioners.

As part of full disclosure, I did not attend any of the training or tutorials, and I could not attend all of the presentations.

You can see the program of talks here.

Thoughts and Take Aways
Visualization in DFIR is a sticky point...in some ways, it may be a solution without a problem.  Okay, so the recommendation is, "don't use pie charts"...got it.  But how does one use visualization techniques to perform analysis, when malware and intrusions follow the Least Frequency of Occurrence?  How can a histogram show an analyst when the bad guy or the malware compromised a system when activities such as normal user activity, software and system updates, etc., are the overwhelming available activity?  Maybe there is a way to take a bite out of this, but I'm not sure that academics can really start to address this until there is a crossover into the practitioner's end of the pool.  I only mention this because it's a recurring thought that I have each time I attend this conference.

As Simson pointed out, much of the current visualization occurs after the analyst has completed their examination and is preparing a report, either for a customer or for presentation in court.  Maybe that's just the nature of the beast.

Swag this year was a plastic coffee cup for the car with the TSK logo, TSK stickers, and a DVD of Autopsy.

Resources
Link to Kristinn's stuff

Thanks
We should all give a great, big Thank You to everyone involved in making both of these conferences possible.  It takes a lot of work to organize a conference...I can only imagine that it's right up there with herding cats down a beach...and providing a forum to bring folks together.  So, to the organizers and presenters, to everyone who worked so hard on making these conferences possible, to those who sat at tables to provide clues to the clueless ("...where's the bathroom?")...thank you.

What else
There is another thing that I really like about DFIR-related conferences; interacting with other DFIR folks that I don't get to see very often, and even those who are not directly involved with what we do on a day-to-day basis.  Unfortunately, it seems that few folks who attend these conferences want to engage and talk about DFIR topics, but now and again I find someone who does.

In this case, a good friend of mine wanted to discuss "...is what we do a 'science' or an 'art'?" at lunch.  And when I say "discuss", I don't mean stand around and listen to others, I mean actively engaging in discussion.  That's what a small group of us...there were only four of us at the table...did during lunch on Tuesday.  Many times, finding DFIR folks at DFIR conferences that want to actively engage in discussion and sharing of DFIR topics...new malware autostart/persistence mechanisms seen, new/novel uses of tools, etc...is hard to do.  I've been to conferences before where, for whatever reason, you just can't find anyone to discuss anything related to DFIR, or to what they do.  In this instance, that wasn't the case, and some fascinating discussion ensued.