Monday, March 02, 2015

How do you "do" analysis?

Everybody remembers "The Matrix", right?  So, you're probably wondering what the image to the right has to do with this article, particularly given the title.  Well, that's easy...this post is about employing various data sources and analysis techniques, and pivoting in order to add context and achieve a greater level of detail in your analysis.  Sticking with just one analysis technique or process, much like simply trying to walk straight through the building lobby to rescue Morpheus, would not have worked.  In order to succeed, Neo and Trinity had to pivot and mutually support each other in order to achieve their collective goal.  So...quite the metaphor for a blog post that involves pivoting, eh?

Timeline Analysis
Timeline analysis is a great technique for answering a wide range of questions.  For malware infections and compromises, timeline analysis can provide the necessary context to illustrate things like the initial infection (or compromise) vector, the window of compromise (i.e., based on when the system was really infected or compromised, if anti-forensics techniques were used), what actions may have been taken following the infection/compromise, the hours during which the intruder tends to operate, and other systems an intruder may have reached to (in the case of a compromise).

Let's say that I have an image of a system thought to be infected with malware.  All I know at this point is that a NIDS alert identified the system as being infected with a particular malware variant based on C2 communications that were detected on the wire, so I can assume that the system must have been infected on or before the date and time that the alert was generated.  Let's also say that based on the NIDS alert, we know that the malware (at least, some variants of it) persists via a Windows service.  Given this little bit of information, here's an analysis process that I might follow, including pivot points:
  1. Load the timeline into Notepad++, scroll all the way to the bottom, and do a search (going up from the bottom) to look for "Service Control Manager/7045" records.
  2. Locate the file referenced by the event record by searching for it in the timeline.  PIVOT to the MFT: parse the MFT, extract the parsed record contents for the file in question in order to determine if there was any time stomping involved.
  3. PIVOT within the timeline; start by looking "near" when the malware file was first created on the system to determine what other activity occurred prior to that event (i.e., what user was logged in, were there indications of web browsing activity, was the user checking their email, etc.)
  4. PIVOT to the file itself: parse the PE headers to get things like compile time, section names, section sizes, strings embedded in the file, etc.  These can all provide greater insight into the file itself.  Extract the malware file and any supporting files (DLLs, etc.) for analysis.
  5. If the malware makes use of DLL side loading, note the persistent application name, in relation to applications used on the system, as well as within the rest of the infrastructure.  
  6. If your timeline doesn't include AV log entries, and there are AV logs on the system, PIVOT to those in order to potentially get some additional detail or context.  Were there any previous attempts to install malware with the same or a similar name or location?  McAfee AV will flag on behaviors...was the malware installed from a Temp directory, or some other location?  
  7. If the system has a hibernation file that was created or modified after the system became infected, PIVOT to that file to conduct analysis regarding the malicious process.
  8. If the malware is known to utilize the WinInet API for off-system/C2 communications, see if the Local Service or Network Service profiles have a populated IE web history (location depends upon the version of Windows being examined). 
  9. If the system you're analyzing has Prefetch files available, were there any specific to the malware?  If so, PIVOT to those, parsing the modules and looking for anything unusual.  
Again, this is simply a notional analysis, meant to illustrate some steps that you could take during analysis.  Of course, it will all depend on the data that you have available, and the goals of your analysis.

Web Shell Analysis
Web shells are a lot of fun.  Most of us are familiar with web shells, at least to some extent, and recognize that there are a lot of different ways that a web shell can be crafted, based on the web server that's running (Apache, IIS, etc.), other applications and content management systems that are installed, etc.  Rather than going into detail regarding different types of web shells, I'll focus just on what an analyst might be looking for (or find) on a Windows server running the IIS web server.  CrowdStrike has a very good blog post that illustrates some web shell artifacts that you might find if an .aspx web shell is created on such a system.

In this example, let's say that you have received an image of a Windows system, running the IIS web server.  You've created a timeline and found artifacts similar to what's described in the CrowdStrike blog post, and now you're read to start pivoting in your analysis.

  1. You find indications of a web shell via timeline analysis; you now have a file name.
  2. PIVOT to the web server logs (if they're available), searching for requests for that page.  As a result of your search, you will know have (a) IP address(es) from where the requests originated, and (b) request contents illustrating the commands that the intruder ran via the web shell.
  3. Using the IP address(es) you found in step 2, PIVOT within the web server logs, this time using the class C or class B range for the IP address(es), to cast the net a bit wider.  This can give you additional information regarding the intruder's early attempts to fingerprint and compromise the web server, as you may find indications of web server vulnerability scans originating from the IP address range.  You may also find indications of additional activity originating from the IP address range(s).
  4. PIVOT back into your timeline, using the date/time stamps of the requests that you're seeing in the web server logs as pivot points, in order to see what events occurred on the systems as a result of requests that were sent via the web shell.  Of course, where the artifacts can be found may depend a great deal upon the type of web shell and the contents of the request.
  5. If tools were uploaded to the system and run, PIVOT to any available Prefetch files, and parse out the embedded strings that point to module loaded by the application, in order to see if there are any additional files that you should be looking to.
Once again, this is simply a notional example of how you might create and use pivot points in your analysis.  This sort of process works not just for web shells, but it's also very similar to the process I used on the IBM ISS ERS team when Chris and I were analyzing SQL injection attacks via IIS web servers; conceptually, there is a lot of overlap between the two types of attacks.

Additional Resources (Web Shells)
Security Disclosures blog post
Shell-Detector
Yara rules - 1aN0rmus, Loki

Memory Analysis
This blog post from Contextis provides a very good example of pivoting during analysis; in this case, the primary data source for analysis was system memory in the form of a hibernation file.  The case stated with disk forensics, and a hit for a particular item was found in a crash dump file, and then the analyst pivoted to the hibernation file.

Adam did a great job with the analysis, and in writing up the post.  Given that this post started with disk forensics, some additional pivot points for the analysis are available:

  1. Pivoting within the memory dump, the analyst could have identified any mutex utilized by the malware.  
  2. Pivoting into a timeline, the analyst may have been able to identify when the service itself was first installed (i.e., "Service Control Manager" record with event ID 7045).
  3. Determining when the malicious service was installed can lead the analyst to the initial infection vector (IIV), and will be extremely valuable if the bad guys used anti-forensic techniques such as time stomping the malware files to try to obfuscate the creation date.
  4. Pivot to the MFT and extract records for the malicious DLL files, as well as the keystroke log file.  Many of us have seen malware that includes a keylogger component that will continually time stomp the keystroke log file as new key strokes are added to it.  

"Doing" Analysis
I received an interesting question a while back, asking for tips on how I "do analysis".  I got to thinking about it, and it made sense to add my thoughts to this blog post.

Most times, when I receive an image, I have some sort of artifact or indicator to work with..a file name or path, a date/time, perhaps a notice from AV that something was detected.  That is the reason why I'm looking at the image in the first place.  And as a result, producing a timeline is obviated by the questions I need to answer; that is to say, I do not create a timeline simply because I received an image.  Instead, I create a timeline because that's often the best way to address the goals of my exam.

When I do create a timeline, I most often have something to look for, to use as an initial starting or pivot point for my analysis.  Let's say that I have a file that I'm interested in; the client received a notification or alert, and that led them to determine that the system was infected.  As such, they want to know what the malware is, how it got on the system, and what may have occurred after the malware infected the system.  After creating the timeline, I can start by searching the timeline for the file listing.  I will usually look for other events "around" the times where I find the file listed...Windows Event Log records, Registry keys being created/modified, etc.

Knowing that most tools (TSK fls.exe, FTK Imager "Export Directory Listing..." functionality) used to populate a timeline will only retrieve the $STANDARD_INFORMATION attributes for the file, I will often extract and parse the $MFT, and then check to see if there are indications of the file being time stomped.  If it does appear that the file was time stomped, I will go into the timeline and look "near" the $FILE_NAME attribute time stamps for further indications of activity.

One of the things I use to help me with my analysis is that I will apply things I learned from previous engagements to my current analysis.  One of the ways I do this is to use the wevtx.bat tool to parse the Windows Event Logs that I've extracted from the image.  This batch file will first run MS's LogParser tool against the *.evtx files I'm interested in, and then parse the output into the appropriate timeline format, while incorporating header tags from the eventmap.txt event mapping file.  If you open the eventmap.txt file in Notepad (or any other editor) you'll see that it includes not only the mappings, but also URLs that are references for the tags.  So, if I have a timeline from a case where malware is suspected, I'll search for the "[MalDetect]" tag.  I do this even though most of the malware I see on a regular basis isn't detected by AV, because often times, AV will have detected previous malware infection attempts, or it will detect malicious software downloaded after the initial infection (credential dumping tools, etc.).

Note: This approach of extracting Windows Event Logs from an acquired image is necessitated by two factors.  First, I most often do not want all of the records from all of the logs.  On my Windows 7 Ultimate system, there are 141 *.evtx files.  Now, not all of them are populated, but most of them do not contain records that would do much more than fill up my timeline.  To avoid that, there are a list of less than a dozen *.evtx files that I will extract from an image and incorporate into a timeline.

Second, I often work without the benefit of a full image.  When assisting other analysts or clients, it's often too cumbersome to have a copy of the image produced and shipped, when it will take just a few minutes for them to send me an archive containing the *.evtx files of interest, and for me to return my findings.  This is not a "speed over accuracy" issue; instead, it's a Sniper Forensics approach that lets me get to the answers I need much quicker.

Another thing I do during timeline analysis is that I keep the image (if available) open in FTK Imager for easy pivoting, so that I can refer to file contents quickly.  Sometimes it's not so much that a file was modified, as much as it is what content was added to the file.  Other times, contents of batch files can lead to additional pivot points that need to be explored.

Several folks have asked me about doing timeline analysis when asked to "find bad stuff".  Like many of you reading this blog post, I do get those types of requests.  I have to remember that sometimes, "bad stuff" leaves a wake.  For example, there is malware that will create Registry keys (or values) that are not associated with persistence; while they do not lead directly to the malware itself (the persistence mechanism will usually point directly to the malware files), they do help in other ways.  One way is that the presence of the key (or value, as the case may be) lets us know that the malware is (or was) installed on the system.  This can be helpful with timeline analysis in general, but also during instances when the bad guy uses the malware to gain access to the system, dump credentials, and then comes back and removes the malware files and persistence mechanism (yeah, I've seen that happen more than a few times).

Another is that the LastWrite time of the key will tell us when the malware was installed.  Files can be time stomped, copied and moved around the file system, etc., all of which will have an effect on the time stamps recorded in the $MFT.  Depending on the $MFT record metadata alone can be misleading, but having additional artifacts (spurious Registry keys created/modified, Windows services installed and started, etc.) can do a great deal to increase our level of confidence in the file system metadata.

So, I like to collect all of those little telltale IOCs, so that when I do get a case of "find the bad stuff", I can check for those indicators quickly.  Do you know where I get the vast majority of the IOCs I use for my current analysis?  From all of my prior analysis.  Like I said earlier in this post, I take what I've learned from previous analysis and apply it to my current analysis, as appropriate.

Sometimes I get indicators from others.  For example, Jamie/@gleeda from Volatility shared with me (it's also in the book) that when the gsecdump credential theft tool is run to extract LSA secrets, the HKLM/Security/Policy/Secrets key LastWrite time is updated.  So I wrote a RegRipper plugin to extract the information and include it in a timeline (without including all of the LastWrite times from all of the keys in the Security hive, which just adds unnecessary volume to my timeline), and since then, I've used it often enough that I'm comfortable with the fidelity of the data.  This indicator serves as a great pivot point in a timeline.

A couple of things I generally don't do during analysis:
I don't include EVERYTHING into the timeline.  Some times, I don't have everything...I don't have access to the entire image.  Someone may send me a few files ($MFT, Registry hives, Windows Event Logs, etc.) because it's faster to do that than ship the image.  However, when I do have an image, I very often don't want everything, as getting everything can lead to a great deal of information being put into the timeline that simply adds noise.  For example, if I'm interested in remote access to a system, I generally do not include Windows Event Logs that focus on hardware monitoring events in my timeline.

I have a script that will parse the $MFT and display the $STANDARD_INFORMATION and $FILE_TIME metadata in a timeline...but I don't use it very often.  In fact, I can honestly say that after creating it, I haven't once used it during my own analysis.  If I'm concerned with time stomping, it's most often only for a handful of files, and I don't see that as a reason for doubling the size of my timeline and making it harder to analyze.  Instead, I will run a script that will display various metadata from each record, and then search the output for just the files that I'm interested in.

I don't color code my timeline.  I have been specifically asked about this...for me, with the analysis process I use, color coding doesn't add any value.  That doesn't mean that if it works for you, you shouldn't do it...not at all.  All I'm saying is that it doesn't add any significant value for me, nor does it facilitate my analysis.  What I do instead is start off with my text-based timeline (see ch. 7 of Windows Forensic Analysis) and I'll create an additional file for that system called "notes"; I'll copy-and-paste relevant extracts from the full timeline into the notes file, annotating various things along the way, such as adding links to relevant web sites, making notes of specific findings, etc.  All of this makes it much easier for me to write my final report, share findings with other team members, and consolidate my findings.

Wednesday, February 11, 2015

Tools

Microsoft recently released an update (KB 3004375) that allows certain versions the Windows OS to record command line options, if Process Tracking is enabled, in the Windows Event Log. Microsoft also recently upgraded Sysmon to version 2.0, with some interesting new capabilities.  I really like this tool, and I use it when I'm doing testing in my lab, to provide more detailed information about what's happening on the system. I like to run both of these side-by-side on my testing VMs, to see the difference in what's reported.  I find this to be very valuable, not only in testing, but also in making recommendations regarding auditing and the use of process creation monitoring tools, such as Carbon Black. Even if you're not able to run something like Cb in your environment, monitoring process creation via the Windows Event Log or the use of Sysmon, and shuttling the records off of the system in to a SEIM, can be extremely valuable.

If you do have Process Tracking enabled in your Windows Event Log, Willi Ballenthin has released a pretty fascinating tool called process-forest that will parse Windows Security Event Logs (Security.evtx) for process tracking events, and assemble what's found into a process tree, sorting by PID/PPID.  Agan, if you've enabled Process Tracking in your logging policy, this tool will be very valuable for displaying the information in your logs in a manner that's a bit more meaningful. If you're a consultant (like me) then having this tool as an option, should the client have the appropriate audit configuration, can provide a quick view of available data that may be very beneficial.
Willi has also released a Python script for parsing AmCache Registry hive files, which were new to Windows 8, and are available in Windows 10.  To get more of an understanding of the information available in this hive file that was first available on Windows 8, check out Yogesh's blog post here, with part 2 here.  RegRipper has had an amcache.pl plugin for over a year.

After reading Jon Glass's blog post on parsing the IE10+ WebCacheV01.dat web history file, I used his code as the basis for creating a script similar to destlist.py, in that I can now parse the history information from the file and include it in my analysis.  This can be very helpful if I need to incorporate it into a timeline, or if I just want to take a look at the information separately.  Thanks to Jon for providing the example code, and to Jamie Levy/@gleeda for helping me parse out the last accessed time stamp information.  Don't expect anything spectacularly new from this code, as it's based on Jon's code...I just needed something to meet my needs.

The NCC Group has released a tool called "Windows Activity Logger", which produces (per the description on the web site), a three hour rolling window of insight into system activity by recording process creation, along with thread creation, LoadImage events, etc.  The free version of the tool allows you to run it on up to 10 hosts.  I'm not sure how effective a "3 hr rolling window" is for some IR engagements (notification occurs months after the fact) but it's definitely a good tool for testing within a lab environment.  I can also see how this can be useful if you have some sort of alerting going on, so that you're able to respond within a meaningful time, in order to take advantage of the available data.

I was doing some reading recently regarding CrowdStrike's new modules in their CrowdResponse tool to assist with collecting application execution information from hosts.  Part of this included the ability to parse SuperFetch files.  As I dug into it a bit more, I ran across the ReWolf SuperFetch Dumper (read about the tool here).

Speaking of Windows 10, there was a recent post to an online forum in which the OP stated that he'd seen something different in the DestList stream of Windows 10 *.automaticDestinations-ms Jump Lists.  I downloaded the Windows 10 Technical Preview, installed it in VirtualBox, and ran it.  I then extracted the two Jump List files from the appropriate folder and started looking at a hex view of their DestList streams.  Within pretty short order, I began to see that many of the offsets that I'd identified previously were the same as they were for Windows 7 and 8, so I ran my destlist.py/.exe tool, and found that they were pretty much the same...the tool worked just fine, exactly as expected.  As yet, there's been nothing specific from the OP about what they'd seen that was different, but it's entirely possible.  Whenever a new version of Windows comes out, DFIR folks seem to immediately ask, "...what's new?"  Why not instead focus on what's the same?  There seem to be more artifacts that don't change much between versions that there are wildly new structures and formats.  After all, the OLE/structured storage format used by the Jump List files has been around for a very long time.

Resources
Dell SecureWorks Tools
WindowsIR: FOSS Tools
Loki - Simple IOC Scanner

Writing Tools
I mentioned during my presentation at OSDFCon that tools like RegRipper come from my own use cases.  I've discussed my motivation for writing DFIR books, but I've never really discussed why I write tools.

Why do I write my own tools?
First, writing my own tools allows me to become more familiar with the data itself.  Writing RegRipper put me in a position to become more familiar with Registry data.  Writing an MFT parser got me much more familiar with the MFT, and forced me to look really hard a some of the short descriptions in Brian's book (File System Forensic Analysis).

Sometimes, I want/need a tool to do something specific, and there simply isn't something available that meets my immediate need, my current use case.  Here's an example...I was once asked to take a look at an image acquired from a system; during the acquisition process, there were a number of sector errors reported, apparently.  I was able to open the image in FTK Imager, but could not extract a directory listing, and TSK fls.exe threw an error and quit before any output was generated.  I wanted to see if I could add file system metadata to a timeline...I was able to use both FTK Imager and TSK icat.exe to extract most of the $MFT file.  Using a Perl script I'd written for parsing the MFT, I was able to incorporate some file system metadata into the timeline...this was something I was not able to do with other tools.

Why do I share the tools I write?
I share the tools I write in the hopes that others will find them useful, and provide feedback or input as to how the tools might be more useful.  However, I know that this is not why people download and use tools.  So, rather than expecting feedback, I now put my tools up on GitHub for two reasons; one is so that I can download them for my own use, regardless of where I am.  Two, there are a very small number of analysts who will actually use to the tools and give me their feedback, so I share the tools for them.

One of the drawbacks of sharing free tools is that those who use them have no "skin in the game".  The tools are free, so it's just as easy to delete them or never use them as it is to download them.  However, there's nothing in the freely available tools that pushes or encourages those who use them to "develop" them further.  Now, I do get "it doesn't work" emails every now and then, and when I can get a clear, concise description of what's going on, or actual sample data to test against, I can see if I can figure out what the issue is and roll out/commit an update.  However, I have also heard folks say, "we couldn't get it to work"...and nothing else.  Someone recently told me that the output of "recbin -d dir -c" was "messed up", and it turns out that what they meant was that the time stamp was in Unix epoch format.

Similarly, those who incorporate free tools into their distributions or courses seem to rarely contribute to the development and extension of those tools.  I know that RegRipper is incorporated into several *nix-based forensic tools distributions, as well as used in a number of courses, and some courses incorporate scenarios and labs into their coursework; yet, it's extremely rare to get something from one of those groups that extends the use of the tool (i.e., even ideas for new or updated plugins).

I am very thankfully to those folks who have shared data; however, it's been limited.  The only way to expand and extend the capabilities of tools like RegRipper and others is to use them thoughtfully, thinking critically, and looking beyond the output to seeing what other data may be available.  If this isn't something you feel comfortable doing, providing the data may be a better way to approach it, and may result in updates much faster.

Why do I write multiple tools?
I know that some folks have difficulty remembering when and how to use various tools, and to be honest, I get it.  There are a lot of tools out there that do various useful things for analysts.  I know that writing multiple tools means that I have to remember which tool to run under which circumstance, and to help me remember, I tend to give them descriptive names.  For example, for parsing Event Log/*.evt files from XP/2003 systems, I called the tool "evtparse.pl", rather than "tool1.pl".

My rationale for writing multiple tools has everything to do with my use case, and the goals of my analysis.  In some cases, I may be assisting another analyst, and may use a single data source (a single Event Log file, or multiple files) in order to collect or validate their findings.  In such cases, I usually do not have access to the full image, and it's impractical for whomever I'm working with to share the full image.  Instead, I'll usually get Registry hives in one zipped archive, and Windows Event Logs in another.

In other cases, I may not need all of the data in an acquired image in order to address my analysis goals.  For example, if the question I'm trying to answer is, "did someone access this Win7 via Terminal Services Client?", all I need is a limited amount of data to parse.

Finally, if I'm giving a presentation or teaching a class, I would most likely not want to run a full application multiple times, for each different data source that I have available.

Tool Requests
Every now and then, I get requests to create a tool or to update some of the tools I've written.  A while back, a good friend of mine reached out and asked me to assist with parsing Facebook chat messages that had been parsed out of an image via EnCase...she wanted to get them all parsed and reassembled into a complete conversation.  That turned out to be pretty fun, and I had an initial script turned around in about an hour, with a final polished script finished by the end of the day (about four hours).

One tool I was asked to update is recbin, something I wrote to parse both XP/2003 INFO2 files as well as the $I* files found in the Vista+ Recycle Bin.  I received a request to update the tool to point it to a folder and parse all of the $I* files in that folder, but I never got around to adding that bit of code.  However, when that person followed up with me recently, it took all of about 5 minutes Googling to come up with a batch file that would help with that issue...

@echo off 
echo Searching %1 for new $I* files...
for %%F in (%1\$I*) do (recbin -f %%F)

This isn't any different from Corey Harrell's auto_rip script.  My point is that getting the capabilities and functionality out of the tools you have available is often very easy.  After I sent this batch file to person who asked about it, I was asked how the output could be listed in CSV format, so I added the "-c" switch to the recbin command, and sent the "new" batch file back.

Tool Updates
Many times, I don't get a request for new capabilities to a tool; instead, I find something interesting and based on what I read, I update one of the tools myself.  A great example of this is Brian Baskin's DJ Forensic Analysis blog post; the post was published on 11 Nov, and on the morning of 12 Nov, I wrote three RegRipper plugins, did some quick testing (with the limited data that I had available), and committed the new plugins to the GitHub repository...all before 8:30am.  The three plugins can be used by anyone doing analysis to validate Brian's findings, and then hopefully expand upon them.

Friday, January 09, 2015

A Smattering of Links and Other Stuff

Registry
Well, 2014 ended with just one submission for the WRA 2/e Contest.  That's unfortunate, but it doesn't alter my effort in updating the book in any way.  For me, this book will be something to look forward to in 2015, and something I'm pretty excited about, in part because I'll be presenting more information about the analysis processes I've been using, processes that have led to some pretty interesting findings regarding various incidents and malware.

In other Registry news, Eric Zimmerman has created an offline Registry parser (in C#) and posted it to GitHub.  Along with Eric's Shellbag Explorer tool, it really seems as if his interest in the Windows Registry is burgeoning, which is great.  Hopefully, this will generate some of the same interest in others.

Tools
Willi has a new tool available called process-forest, which parses event ID 4688 records within the Security.evtx file to develop a process tree.  If you have the necessary auditing enabled, and have increased the default size of your Security Event Log, this tool will provide you with some great data!

Tool Updates
Speaking of the Registry, I've made some updates to several of my tools.  One was to extend the inprocserver.pl plugin by creating a RegRipper plugin (fileless.pl) that could be used to scan any hive file for indications of "fileless" malware, such as Phasebot or Poweliks.  My testing of this plugin was limited, but it works for other search criteria.

I've also made some minor updates to other tools.

Widening the Aperture through Sharing
I was doing some reading recently regarding attribution as a result of DFIR analysis, which included Richard's recent post. From there, I followed the link to Rid and Buchanan paper (PDF), which was fascinating reading.  I took a lot of what I read and applied it to my thinking on threat intel in general, and not just to attribution.  One of the things I've been noodling over is how to widen the aperture on the indicators that we initially collect/have access to, and how that relates to the incident response process.

One of the big things that immediately jumped into my head was "sharing".

Secureworks Research Blog post
Speaking of sharing, this article (titled "Sleeper Agents") was published recently on the Dell Secureworks Research Blog.  It's a great example of something seen in the wild, and

Sharing Indicators
Continuing with the sharing theme, @binaryz0ne posted an article to his blog regarding artifacts of user account creation, looking at differences between the use of the command line and GUI for creating local accounts on a system (i.e., not AD accounts).

A couple of things to point out...

First, this testing is for account creation.  The accounts are being created, but profiles are not created until someone logs in using the credentials, as mentioned by Azeem.

Second, if you were interested in just account creation information, then collecting ALL available timeline information might be time consuming.  Let's say you found the event log record for account creation and wanted to focus on just that aspect of analysis.  Using the "Sniper Forensics" principles, you could create a timeline from just the Windows Event Logs (Security, LocalSessionManager, RemoteConnectionManager, maybe even TaskScheduler, just in case...), the SAM Registry hive (samparse_tln.pl RegRipper plugin), prefetch files (if available), and the user's (account collected from Windows Event Log record) NTUSER.DAT and USRCLASS.DAT.

I've seen instances of both (use of CLI and GUI to create accounts...) in the wild, and it's great to see someone putting in the effort to not only test something like this, but to also share their findings.  Thanks, Ali!

I've been doing some testing of Powershell, and have been using a .ps1 file to create a user and add it to the local Administrators group, and finding some truly fascinating artifacts.

Python
One of the things I've been working on (well, working off and on...) is learning to program in Python.  I do plan to maintain my Perl programming, but learning Python is one of those things I've laid out as a goal for myself.  I've already written one small program (destlist.py) that I do use quite often for parsing the DestList streams out of automaticDestination Jump Lists, including adding that information to a timeline.  I don't expect to become an expert programmer, but I want to become more proficient, and the best way to do that is to start developing projects.

Not long ago, I was doing some reading and ran across this ISC post that mentions the impacket library (from CoreLabs), and I thought that was pretty interesting.  Not long after, I was reading Jon Glass's blog and ran across another mention of the impacket library, and solutions Jon has been looking at for parsing the IE10+ WebCacheV01.dat history database (part 3 of which can be found here).  I've been pretty successful using the NirSoft ESE Database Viewer so far, but like Jon, I may reach the point where I'd like to have something that I can extend, or better yet, provide output in a format that I can easily incorporate into my analysis processes.

Monday, January 05, 2015

What It Looks Like: Disassembling A Malicious Document

I recently analyzed a malicious document, by opening it on a virtual machine; this was intended to simulate a user opening the document, and the purpose was to determine and document artifacts associated with the system being infected.  This dynamic analysis was based on the original analysis posted by Ronnie from PhishMe.com, using a copy of the document that Ronnie graciously provided.

After I had completed the previous analysis, I wanted to take a closer look at the document itself, so I disassembled the document into it's component parts.  After doing so, I looked around on the Internet to see if there was anything available that would let me take this analysis further.  While I found tools that would help me with other document formats, I didn't find a great deal that would help me this particular format.  As such, I decided to share what I'd done and learned.

The first step was to open the file, but not via MS Word...we already know what happens if we do that.  Even though the document ends with the ".doc" extension, a quick look at the document with a hex editor shows us that it's format is that of the newer MS Office document format; i.e., compressed XML.  As such, the first step is to open the file using a compression utility, such as 7Zip, as illustrated in figure 1.

Figure 1: Document open in 7Zip


As you can see in figure 1, we now have something of a file system-style listing that will allow us to traverse through the core contents of the document, without actually having to launch the file.  The easiest way to do this is to simply extract the contents visible in 7Zip to the file system.

Many of the files contained in the exported/extracted document contents are XML files, which can be easily viewed using viewers such as Notepad++.  Figure 2 illustrates partial contents for the file "docProps/app.XML".

Figure 2: XML contents


Within the "word" folder, we see a number of files including vbaData.xml and vbaProject.bin.  If you remember from PhishMe.com blog post about the document,  there was mention of the string 'vbaProject.bin', and the Yara rule at the end of the post included a reference to the string “word/_rels/vbaProject.bin”.  Within the "word/_rels" folder, there are two files...vbaProject.bin.rels and document.xml.rels...both of which are XML-format files.  These documents describe object relationships within the overall document file, and of the two, documents.xml.rels is perhaps the most interesting, as it contains references to image files (specifically, "media/image1.jpg" and "media/image2.jpg").  Locating those images, we can see that they're the actual blurred images that appear in the document, and that there are no other image files within the extracted file system.  This supports our finding that clicking the "Enable Content" button in MS Word did nothing to make the blurred documents readable.

Opening the word/vbaProject.bin file in a hex editor, we can see from the 'magic number' that the file is a structured storage, or OLE, file format.  The 'magic number' is illustrated in figure 3.

Figure 3: vbaProject.bin file header


Knowing the format of the file, we can use the MiTeC Structured Storage Viewer tool to open this file and view the contents (directories, streams), as illustrated in figure 4.

Figure 4: vbaProject


Figure 5 illustrates another view of the file contents, providing time stamp information from the "VBA" folder.

Figure 5: Time stamp information


Remember that the original PhishMe.com write-up regarding the file stated that the document had originally been seen on 11 Dec 2014.  This information can be combined with other time stamp information in order to develop an "intel picture" around the infection itself.  For example, according to VirusTotal, the malicious .exe file that was downloaded by this document was first seen by VT on 12 Dec 2014.  The embedded PE compile time for the file is 19 June 1992.  While time stamps embedded within the document itself, as well as the PE compile time for the 'msgss.exe' file may be trivial to modify and obfuscate, looking at the overall wealth of information provides analysts with a much better view of the file and its distribution, than does viewing any single time stamp in isolation.

If we continue navigating through the structure of the document, and go to the VBA\ThisDocument stream (seen in figure 4), we will see references to the files (batch file, Visual Basic script, and Powershell script) that were created within the file system on the infected system.

Summary
My goal in this analysis was to see what else I could learn about this infection by disassembling the malicious document itself.  My hope is that the process discussed in this post will serve as an initial roadmap for other analysts, and be extended in the future.

Tools Used
7Zip
Notepad++
Hex Editor (UltraEdit)
MiTeC Structured Storage Viewer

Resources
Lenny Zeltser's blog - Analyzing Malicious Documents Cheat Sheet
Virus Bulletin presentation (from 2009)
Kahu Security blog post - Dissecting a Malicious Word document
Document-Analyzer.net - upload documents for analysis
Python OLETools from Decalage
Trace Evidence Blog: Analyzing Weaponized RTF Documents

Addendum 6 Jan 2015 - Extracting the macro
I received a tip on Twitter from @JPoForenso to take a look at Didier Stevens' tools zipdump.py and oledump.py, as a means for extracting the macro from the malicious document.  I first tried oledump.py by itself, and that didn't work, so I started looking around for some hints on how to use the tools together.  I eventually found a tweet from Didier that had illustrated how to use these two tools together.  From there, I was able to extract the macro from within the malicious file.  Below are the steps I followed in sequence to achieve the goal of extracting the macro.

1. "C:\Python27>zipdump.py d:\tips\file.doc" gave me a listing of elements within the document itself.  From here, I knew that I wanted to look at "word/vbaProject.bin".

2.  "C:\Python27>zipdump.py -d d:\tips\file.doc word/vbaProject.bin" gave me a bunch of compressed stuff sent to the console.  Okay, so good so far.

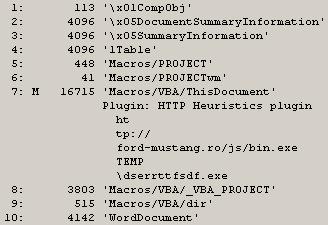
3.  "C:\Python27>zipdump.py -d d:\tips\file.doc word/vbaProject.bin | oledump.py" gave me some output that I could use, specifically:
  1:       445 'PROJECT'
  2:        41 'PROJECTwm'
  3: M   20159 'VBA/ThisDocument'
  4:      3432 'VBA/_VBA_PROJECT'
  5:       515 'VBA/dir'

Now, I've got something I can use, based on what I'd read about here.  At this point, I know that the third item contains a "sophisticated" macro.

4.  "C:\Python27>zipdump.py -d d:\tips\file.doc word/vbaProject.bin | oledump.py -s 3 -v" dumps a bunch of stuff to the console, but it's readable.  Redirecting this output to a file (i.e., " > vba.txt") lets me view the entire macro.

Addendum 14 Jan 2015 - More Extracting the Macro
Didier posted this following image to Twitter recently, illustrating the use of oledump.py:


Tuesday, December 30, 2014

What It Looks Like: Malware Infection via a Weaponized Document


Okay...I lied.  This is my last blog post of 2014.

A couple of weeks ago, Ronnie posted regarding some analysis of a weaponized document to the PhishMe.com blog.  There is some interesting information in the post, but I commented on Twitter that there was very little post-mortem analysis. In response, Ronnie sent me a copy of the document.  So, I dusted off a Windows 7 VM and took a shot at infecting it by opening the document.

Analysis Platform
32-bit Windows 7 Ultimate SP1, MS Office 2010, with Sysmon installed - VM running in Virtual Box.  As with previous dynamic analysis I've performed, Sysmon provides not only place holders to look for, but also insight into what can be trapped via a process creation monitoring tool.

Process
Run Windows Updates, reboot to a clean clone of the VM, and double-click the document (sitting on the user profile desktop).  The user profile used to access the document had Admin-level privileges, but UAC had not been disabled.  After waiting a few moments after the launch of the document, the application (MS Word) was closed, and the VM shut down cleanly.

I purposely did not run a packet capture tool, as that was something that had been done already.

Analysis
Initial attempts to view the file in a hex editor caused MSE to alert on TrojanDownloader:O97M/Tarbir.  After opening the file, waiting, and shutting down the VM cleanly, I created a timeline using file system, WEVTX, Prefetch, and Registry metadata.  I also created a separate micro-timeline from the USN change journal - I didn't want to overpopulate my main timeline and make it more difficult to analyze.

Also, when I extracted the file from the archive that I received, I named it "file.docx", based on the contents (the structure was not the older-style OLE format).  When I double-clicked the file, MS Word opened but complained that there was something wrong with the file.  I renamed the file to "file.doc", and everything ran in accordance with Ronnie's blog post.

Findings
As expected, all of the files that Ronnie mentioned were created within the VM, in the user's AppData\Local\Temp folder.  Also as expect, the timeline I created was populated by artifacts of the user's access to the file.  Since the "Enable Editing" button had to be clicked in order to enable macros (and run the embedded code), the TrustRecords key was populated with a reference to the file.  Keep in mind that many of the artifacts that were created (JumpList entries, Registry values, etc.) will persist well beyond the removal/deletion of the file and other artifacts.

While I did not capture any of the off-system communication (i.e., download of the malware), Sysmon provided some pretty interesting information.  I looked up the domain in Ronnie's post, and that gave me the IP address "50.63.213[.]1".  I then searched for that IP address in my timeline, and found one entry, from Sysmon...Powershell had reached off of the system (Sysmon/3 event) to that IP address (which itself translates to "p3nlhg346c1346.shr.prod.phx3.secureserver[.]net"), on port 80.  Artifacts of Powershell's off-system communications were the HKLM/Software/Microsoft/Tracing/powershell_RASMANCS and HKLM/Software/Microsoft/Tracing/powershell_RASAPI32 keys being created.

Per Ronnie's blog post, the file "444.exe" is downloaded.  The file is deleted after being copied to "msgss.exe".  The strings within this file (msgss.exe) indicate that it is a Borland Delphi file, and contains the strings "GYRATOR" and "TANNERYWHISTLE" (refer to the icon used for the file).  The PE compile time for the file is 19 Jun 1992 22:22:17 UTC.  The VirusTotal analysis of this file (originally uploaded to VT on 12 Dec) can be found here.

Persistence Mechanism:  User's Run key; the value "OutLook Express" was added to the key, pointing to the msgss.exe file.

An interesting artifact of the infection occurred at the same time that the msgss.exe file was created on the system and the Run key value created so that the malware would persist; the key "HKCU/full" was created.  The key doesn't have any values...it's just the key.

To extend Corey's discussion of Prefetch file contents just a bit, the Prefetch file for WinWord.exe included references to RASMAN.DLL, RASAPI32.DLL, as well as other networking DLLs (W2_32.DLL, WINHTTP.DLL).

Given the off-system communications, I located and extracted the WebCachev01.dat file that contains the IE history for the user, and opened it using ESE DatabaseView.  I found no indication of the host being contacted, via either IP address or name.  Additional testing is required but it would appear that the System.Net.WebClient object used by Powershell does not leave traces in the IE history (i.e., the use of the WinInet API for off-system communications would leave traces in the history).  If that's the case, then from an infrastructure perspective, we need to find another means of detecting this sort of activity, such as through process creation monitoring, the use of web proxies, etc.

Take-Aways
1. Threat intel cannot be based on analysis in isolation.

Okay, I understand that this is just a single document and a single infection, and does not specifically represent an APT-style threat, but the point here is that you can't develop "threat intelligence" by analyzing malware in isolation.  In order to truly develop "threat intelligence", you have to look how the adversary operates within the entire infrastructure eco-system; this includes the network, memory, as well as on the host.

I'm also aware that "APT != malware", and that's absolutely correct.  The findings I've presented here are more indicators than intel, but it should be easy to see not just the value of the analysis, but also how it can be extended.  For example, this analysis might provide the basis for determining how an adversary initially gained access to an infrastructure, i.e., the initial infection vector (IIV).  Unfortunately, due to a number of variables, the IIV is often overlooked, or assumed.  When the IIV is assumed, it's often incorrect.  Determining the IIV can be used to see where modifications can be made within the infrastructure in order to improve prevent, detection, and response.

Looking specifically at the analysis of this weaponized document, Ronnie provided some insight, which I was then able to expand upon, something anyone could have done.  The focus of my analysis was  to look at how the host system was impacted by this malware; I can go back and redo the analysis (re-clone the VM), and run the test again, this time pausing the VM and capturing the memory for analysis via Volatility, and extend the understanding of the impact of this document and malware even further.  Even with just the timeline, the available indicators have been expanded beyond the domain and hash (SHA-256) that was available as of 15 Dec.  By incorporating this analysis, we've effectively moved up the Pyramid of Pain, which is something we should be striving to do.  Also, be sure to check out Aaron's Value of Indicators blog post.

2.  Host analysis significantly extends response capability.

The one big caveat from this analysis is the time delta between "infection" and "response"; due to the nature of the testing, that delta is minimized, and for most environments, is probably unrealistic.  A heavily-used system will likely not have the same wealth of data available, and most systems will very likely not have process creation monitoring (Sysmon).

However, what this analysis does demonstrate is, what is available to the responder should the incident be discovered weeks or months after the initial infection.  One of the biggest misconceptions in incident response is that host-based analysis is expensive and not worth the effort, that it's better to just burn the affected systems down and then rebuild them.  What this analysis demonstrates is that through host analysis, we can find artifacts that persist beyond the deletion/removal of various aspects of the infection.  For example, the file 444.exe was deleted, but the AppCompatCache and Sysmon data provided indications that the file had been executed on the system (the USN change journal data illustrated the creation and subsequent deletion of the file).  And that analysis doesn't have to be expensive, time consuming, or difficult...in fact, it's pretty straightforward and simple, and it provides a wealth of indicators that can be used to scope an incident, even weeks after the initial infection occurred.

3.  Process creation monitoring radically facilitates incident response.

I used Sysmon in this test, which is a pretty good analog for a more comprehensive approach, such as Sysmon + Splunk, or Carbon Black.  Monitoring process creation lets us see command line arguments, parent processes, etc.  By analyzing this sort of activity, we can develop prevention and detection mechanisms.

This also shows us how incident response can be facilitated by the availability of this information.  Ever since my early days of performing IR, I've been asked what, in a perfect world, I'd want to have available to me, and it's always come back to a record of the processes that had been run, as well as the command line options used.  Having this information available in a centralized location would obviate the need to go host-to-host in order to scope the incident, and could be initially facilitated by running searches of the database.

Resources
Lenny Zeltser's Analyzing Malicious Documents Cheat Sheet

Monday, December 29, 2014

Final Post of 2014

As 2014 draws to a close, I thought I'd finish off the year with one last blog post.  In part, I'd like to thank some folks for their contributions over the past year, and to look forward to the coming year for what they (and others) may have in the coming year.

I wanted to thank two people in particular for their contributions to the DFIR field during 2014.  Both have exemplified the best in information sharing, not just in providing technical content but also in providing content that pushes the field toward better analysis processes.

Corey's most recent blog post continues his research into process hollowing, incorporating what he's found with respect to the Poweliks malware.  If you haven't taken a good look at his blog post and incorporated this into your analysis process yet, you should strongly consider doing so very soon.

Maria's post on time stomping was, as always, very insightful.  Maria doesn't blog often but when she does, there's always some great content.  I was glad to see her extend the rudimentary testing I'd done and blogged about, particularly because very recently, I'd seen an example of what she'd blogged about during an engagement I was working on.

Maria's also been getting a lot of mileage out of her Google cookies presentation, which I saw at the OSDFCon this year.  If you haven't looked at the content of her presentation, you really should.  In the words of Hamlet, "There are more things in heaven and earth, Horatio, than are dreamt of in your philosophy", and I'm sure Maria was saying, "There are more things in a Windows image than are dreamt of in your timeline."

Tying both Corey and Maria's contributions together, I was doing some analysis recently regarding a particular malware variant that wrote it's files to one location, copied them to another, time stomped those files, and injected itself into the svchost.exe process.  This variant utilized the keystroke logging capability of the malware, and the keystroke log file was re-stomped after each successive update.  It was kind of like an early nerd Christmas gift to see what two well respected members of the community had talked about right there, in the wild.  In the words of one of my favorite characters, "Fascinating."

Volatility
The year would not be complete without a huge THANK YOU to the Volatility folks for all they do, from the framework, to the book, to the training class.  2014 saw me not only attending the course, but also receiving a copy of the book.

Shellbags
On the whole, it might be fair to refer to 2014 (maybe just the latter half) as the "Year of the Shellbag Research".  Eric Zimmerman (Shellbag Explorer), Willi Ballenthin, Dan Pullega, and Joachim Metz should be recognized for the work they've been putting into analyzing and documenting shellbags.  To learn more about what Eric and others have done to further the parsing and analysis of shellbags, be sure to check out David Cowen's Forensic Lunch podcasts (28 Nov, 12 Dec).

TriForce
Speaking of David Cowen, I still think that TriForce is a great example of the outcome of research in the field of forensic analysis.  Seriously.  I don't always use things like the USN change journal in my analysis...sometimes, quite simply, it's not applicable...but when I have incorporated into a timeline (by choice...), the data has proved to be extremely valuable and illuminating.

There are many others who have made significant contributions to the DFIR field over the past year, and I'm sure I'm not going to get to every one of them, but here are a few...

Ken Johnson has updated his file history research.
Basis Technology - Autopsy 3.1
Didier Stevens - FileScanner
Foxton Software - Free Tools
James Habben - Firefox cache and index parsers

Lateral Movement
Part of what I do puts me in the position of tracking a bad guy's lateral movement between systems, so I'm always interested in seeing what other analysts may be seeing.  I ran across a couple of posts on the RSA blog that discussed confirming Remote Desktop Connections (part 1part 2).  I'm glad to see someone use RegRipper, but I was more than a little surprised that other artifacts associated with the use of RDP (either to or from a system) weren't mentioned, such as RemoteConnectionManager Windows Event Log records, and JumpLists (as described in this July, 2013 blog post).

One of the things that I have found...interesting...over time is the number of new sources of artifacts that get added to the Windows operating system with each new iteration.  It's pretty fascinating, really, and something that DFIR analysts should really take advantage of, particularly when we no longer have to rely on a single artifact (a login record in the Security Event Log) as an indicator, but can instead look to clusters of artifacts that serve to provide an indication of activity.  This is particularly valuable when some of the artifacts within the cluster are not available...the remaining artifacts still serve as reliable indicators.

WRA Contest
Finally, as the year draws to a close, here's an update on the WRA 2/e Contest. To date (in over 2 months) there has been only a single submission.  I had hoped that the contest would be much better received (no coding required), but alas, it was not to be the case.

Monday, December 08, 2014

10 Years of Blogging

That's right...my first blog post was ten years ago today.  Wow.

Over the passed ten years, some things have changed, and others haven't.

As the year comes to a close, don't forget about the WRF 2/e Contest.

Thursday, October 23, 2014

WRF 2/e Contest

I recently posted that Syngress has agreed to publish a second edition of Windows Registry Forensics, and in that post, I mentioned that I wanted to provide those in the community with an opportunity to have input into the content of the book prior to it being published.  I know that it's only been a couple of days since the post was published, but historically, requests like these haven't really panned out.  As such, I wanted to take something of a different approach...at the recommendation of a friend, and stealing a page from the Volatility folks, I'm starting a contest for submissions of "case studies" to appear in the second edition.

Contest
So what I'm looking for is submissions of detailed case studies (or "write-ups", "war stories", etc...I don't want to get tangled up on the terminology) of your triumphs via and innovations in Registry analysis.

Please read through this entire blog post before sending in a submission.
What I don't want is case information, user and system names, etc.  Please provide enough detail in your write-up to give context, but not so much that case information is exposed and privacy is violated.

For the moment, I plan to accept submissions until midnight, 31 Dec 2014.  I may extend that in the future...it really depends on how the schedule for the book writing works out, how far I get, how many submissions come in, etc.  The really good submissions will be included in the book, and the author of the submission will received a signed copy of the book.  And yes, when I say "signed", I mean by me.  That also means that your submission needs to include a name and email address, so that I can reach back to you, if your submission is accepted, and get your mailing address.

I'm looking for the top 10 or so submissions; however, if there are more really good ones than just ten, I'll consider adding them, as well.

Consideration will be given to...
Those submissions that require the least effort to incorporate into the book, with respect to spelling and grammar.  I'm all about cut-and-paste, but I don't want to have the copy editor come back with more modifications and edits than there is original text.  I can take care of incorporating the submission into the book in the correct format, but I don't want to have to spend a great deal of time correcting spelling and grammar.

Those submissions that are more complete and thorough, illustrating the overall process.  For example, "...I looked at this value..." or "...I ran RegRipper..." isn't nearly as useful as correlating multiple Registry keys and values, even with other data sources (i.e., Windows Event Logs, etc.).

Those submissions that include more than just, "...I used RegRipper..." or "...I used auto_rip...".  Submissions should talk about how tools (any tools, not just the ones mentioned...) were used.

Those submissions that include process, data, results, RR plugins used, created, or modified, etc.

Note that if you include the newly created or modified plugin along with your submission, the plugin will be added to the RR distribution.

Submissions
Send submissions so to me as text.  Use "WRF 2/e contest submission" as the subject line.   If you have images (screen captures, etc.) that you'd like to share, reference the image in the text ("insert figure 1 here"), and provide the image in TIFF format.

If you have multiple files (the write-up, a plugin, images, etc.), just zip them up.

Please include your name along with the information.  If you do not want your name included in the content when it's added to the book, please specify as such...however, anonymous submissions will not be considered, as I may want to reach back to you and ask a clarifying question (or two).  So, please also be willing to answer questions!  ;-)

Please let me know if it would be okay to post the submission to this blog, and if so, should your name be included (or not).

If you have any questions about this contest, please feel free to ask.

Wednesday, October 22, 2014

RegRipper v2.8 is now on GitHub

RegRipper v2.8 is now available on GitHub.

From this point forward, this repository should be considered THE repository for RegRipper version 2.8.  If you want a copy of RegRipper, just click the "Download ZIP" button on the right of the browser window, and save the file...doing so, you'll have the latest-and-greatest set of plugins available.

If you have any questions, please feel free to contact me.

Tuesday, October 21, 2014

Windows Event Logs

Dan recently tweeted:

Most complete forensics-focused Event Log write-ups?

I have no idea what that means.  I'm going to assume that what Dan's looking for is information regarding Event Logs records that have been found useful or valuable to forensic analysts, or potentially could be.

EVT vs EVTX
Windows XP is no longer supported by Microsoft, but there are still XP and 2003 systems out there, and as such, some of us are still going to need to know the difference between Event Logs (XP, 2003), and Windows Event Logs (Vista+).

Besides the binary differences in the records and Event Log files themselves, on XP/2003, there were three main Event Log files; System, Application, and Security.  On my Windows 7 system, a 'dir' of the winevt\Logs folder reports 143 files.  So, there is a LOT of information being recorded by default on a Windows 7 system; while not all of it may be useful to you, there is a great deal of information that can be extracted from the logs when used properly.

Wevtx.bat
When I released Windows Forensic Toolkit 4/e, one of the things included in the additional materials is a batch file, wevtx.bat.  What the batch file does is use LogParser to parse a directory full of .evtx files, and then parse those entries into TLN format for inclusion in a timeline.  The tool evtxparse.exe, used by the batch file, makes use of a mapping file (i.e., eventmap.txt) to map event source/ID pairs to an artifact category tag.  As such, when the entry in written to a timeline, records such as "Microsoft-Windows-Security-Auditing/4624" are prepended with an appropriate tag (i.e., "[Logon]"), based on the artifact category.

I really love this tool!  What I like about it is that it's easy to update (eventmap.txt is just a text file), I can add comments to it to show the source of the information I used to map an event record to something specific, and it acts as a fantastic little repository for all of my past experiences.  Not only is it a great repository, but it's incorporated right into the tools that I use on just about every engagement.

Records
Here are some of the event source/ID pairs that I've found to be useful during investigations, for such things as malware detection, determining the window of compromise, etc.  I'll say up front that these records are not 100% infallible, and may not have extremely high fidelity (some do, others don't...), but they've worked quite well for me at one time or another, so I'll share them here.

Microsoft-Windows-DNS-Client/1014 – DNS name resolution timeout; I've used this one more than once to help demonstrate that malware was on a system, even in the face of anti-forensics techniques (time stomping the malware files, deleting the malware files, etc.). It's not a 100%, infallible indicator, but it's worked for me more than once.  What has also helped is when this event record was seen; in a timeline, I could see that it occurred shortly after a user logged into a laptop, and before the user connected the system to a WAP.  This helped me narrow down the persistence mechanism for the malware.

Microsoft-Windows-Security-Auditing/4720 - user account created; because the bad guys do this from time to time.

McLogEvent/257 – McAfee malware detection - McAfee AV may detect malware behaviors (i.e., run from a Temp folder, etc.) without actually detecting the EXE itself.  This can be very valuable in helping you determine how malware got onto a system.  Also, the AV product may be configured to warn only, and take no action..so, correlate the event records (UTC) to the entries in the McAfee logs (local system time)

Microsoft-Windows-Windows Defender/3004 – Windows Defender malware detection

Service Control Manager/7045 – A service was installed on the system

Service Control Manager/7030 – A service is configured to interact with the desktop

Microsoft-Windows-TaskScheduler/106 - New Scheduled Task registration

Beyond individual event records (source/ID pairs), one of the aspects of the newer versions of Windows (in particular, Windows 7) is that there are a lot of events that are being recorded by default, across multiple Event Log files.  What I mean is that when some events occur, multiple event records are recorded, often across different Event Log files.  For example, when a user logs into a system at the console, there will be an event recorded in the Security Event Log, a couple in the Microsoft-Windows-TerminalServices-LocalSessionManager/Operational.evtx log, and a couple of events will also be recorded in the Microsoft-Windows-TaskScheduler/Operational.evtx log.  Alone, each of these individual events may get little attention from an analyst, but when placed together in a timeline, they leave an indelible mark indicating that a user logged into the system.

Now, what's really great about this is that some of the Event Logs "roll over" faster than others.  As such, some of the source/ID pairs that are part of an indicator cluster may have been expired from their respective Event Logs.  However, the remaining source/ID pairs in the cluster will still provide a very good indicator that that event in question took place.  This is particular useful for infrequent events, and I've used this information more than once to demonstrate repeated activity going back weeks and even months prior to what was thought to be the date of interest.

Anti-Forensics
Event auditing is one of those things that just happens in the background on Windows systems.  This is great, because sometimes Event Log records can help us determine if anti-forensics techniques have been employed.  For example, using Event Log records, you can determine if someone has changed the system time.

During an exam, I found that a system had been infected with malware that installed as a Windows service, and during the installation process, the .exe file had been time-stomped.  Fortunately, when the malicious service was installed, an event source/ID pair of "Service Control Manager/7045" was created, indicating that a new service had been installed on the system.  I was able to correlate that information with other sources (MFT, etc.) to better determine the correct time of when the malicious .exe was created on the system, and nail down the infection vector.

Carving
If you need to carve Windows Event Log records, for any reason...from unallocated space, memory, the pagefile, whatever...the tool to use is Willi Ballentin's EVTXtract. The "tool" is really a set of Python scripts that you run consecutively against the data in order to recover Windows Event Log records.  I've used these scripts a couple of times, and even had a fellow team member use them on an engagement and quite literally recover the "smoking gun".

When carving for deleted records on a Windows XP or 2003 system, I use a custom Perl script that I wrote that's based on some of the code I've released with my books.

Timelines
When all this is said and done, a blog post on just individual Windows Event Log records isn't really all that valuable.  Yes, I've created timelines from just a handful of *.evtx files, for use in triage, etc.  This has proved to be extremely valuable to me.

Resources
WindowsIR: Timeline Analysis
SANS Reading Room: Detecting Security Events Using Windows Workstation Event Logs
NSA: Spotting the Adversary with Windows Event Log Monitoring

Monday, October 20, 2014

Publishing DFIR Books

I recently received notification that Syngress is interesting in publishing a second edition of Windows Registry Forensics.  I submitted my proposed outline, the reviews of which were apparently favorable enough to warrant a second edition.

I've blogged before regarding writing DFIR books, and that effort seems to have fizzed a bit.  I wanted to take the opportunity to give another shot and see if I couldn't resurrect this topic, or a portion of it, just a bit.  So, the purpose of this blog post is two-fold: to set expectations of the upcoming edition, as well as offer those in the community who are interested to have input into the development (what goes in it) of the book.

Based on the reviews of my proposed outline, as well as some of the online reviews (Amazon, SecurityXploded, etc.), I wanted address a few of the comments I  tend to see more frequently than most, and then allow those who read this post to make their own comments.

From the SecurityXploded review:

It would have been better if author would have put up the approach or step by step procedure one should follow while analyzing live & offline system.

...and...

Putting things straight and then discussing relevant tools at each step will be more beneficial.

This is always an interesting statement to pursue, in part because I see it pretty often in things I've written (such as the HowTo blog posts from July 2013), as well as course materials and presentations I, and others, have put together.  As I'm sure others have done, I try to write something that is general enough to apply across multiple situations, and hope that the reader is able to extrapolate what I've written so it can be used in their specific situation.  My thinking...and it may be wrong...is that analysts must be able to take what they've learned from white papers, presentations, training courses, and other sources, and apply that information and knowledge to what they have available to them.  Not everything that an analyst encounters is going to fit neatly into a training course or whitepaper; there's always going to be some twist or variation, based on the goals of the examination, the data available, etc.  As such, analysts need to be able to build on core principles and basic knowledge to be able to meet the challenges before them.

For example, an analyst should be able to review the SANS checklist for analyzing USB devices on Windows 7, read this HowTo (Correlate an attached device to a user) and this HowTo (Determine user access to files), and be able to determine the files a user may have accessed from a thumb drive that had been attached to their system.  Part of this entails that there has to be some point at which a common, baseline level of knowledge must be assumed.  For example, do you assume that most folks know what the Registry is, or how to determine the CurrentControlSet from a System hive extracted from an acquired image?

This is why I advocate that analysts must share their experiences; no one of knows everything, but together, we can know more than any one of us.  None of us is going to have the same experiences as everyone else, but we can all learn from each other's experiences.

Another comment from the SecurityXploded blog post:

However if you are expecting to cover all those important registry locations then you will be disappointed and it is not feasible in one book. 

This is exactly right, and goes back to one of the core things I learned about writing DFIR books...you're not going to make everyone happy.  Someone's always going to be disappointed about what they didn't find in the book.  But you know what...that's okay.  It has to be...if someone tried to write a book that covered everything, that book would never be completed.

I've been working directly in the DFIR field for a little more than 14 years, and I will be the first to admit, I have not seen everything there is to see.  I've done DFIR in an internal, FTE position, as well as as a consultant.  For a bit more than three years, I did PCI response while at IBM ISS.  While my work has evolved over time, there is still a great deal that I haven't seen, and when I write books or blog posts, I most often base what I write about my own direct experiences.  Now and again, someone will share data with me, and I will learn a little something from their experiences.  I like to sprinkle those indirect experiences in, as well, because they broaden the reach of the material.

In WRF 2/e, I do plan to provide examples of analysis processes I've used, based on goals I've been given, as well as things that I've seen during analysis.  However, no one should expect to pick up this book (or any other DFIR book, for that matter) and find the answer to their specific issue or question.  This is particularly true if no effort is made to contact the author while the book was being written.

From the WRF 2/e outline reviews, as well as from other sources, I've seen this little gem:

You need to provide a chapter on Windows Phone 8.

Anyone remember this blog post?  There were two important take-aways from that blog post.  One was that RegRipper does work with the Windows Phone 8 Registry, and what's needed is sample data and input into what examiners find important, so that plugins can be written.  The second is that the hive files were provided to me...I do not own a Windows Phone 8, nor do I have access to these devices, through work or any other means.  Cindy Murphy did send me some hive files extracted from a Windows Phone 8, but that's one system and a very limited amount of data.  I can't write about what I don't know and didn't experience, and can't provide screen captures illustrating data that I do not have.  Would I like to write more about the Windows Phone 8, particularly the Registry?  Sure.  Without a doubt.  But without actual data, I can't really be expected to write much of anything, can I?

Okay, those are just a few of the comments/statements I've seen in reviews, and like I said, I only wanted to address those that I see regularly.  If you have any thoughts or comments about the content that should appear in WRF 2/e, I'd be glad to hear and consider them.  Thanks.